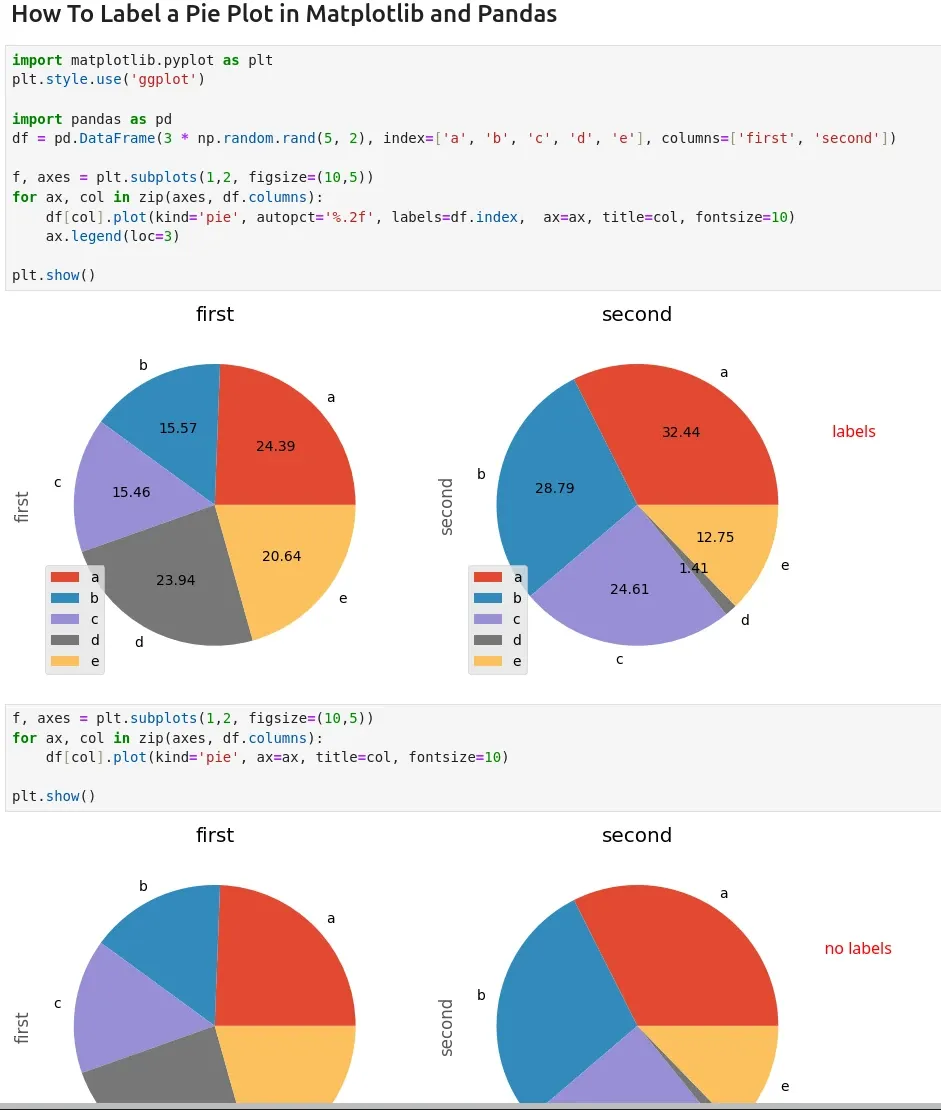
To label pie plot in Matplotlib and Pandas DataFrame we can use:
autopct='%.2f'- to add the values on the pie chartlabels=df.indexandax.legend(loc=3)to add a legend with labels
Steps to add label to pie plot
- Import libraries - matplotlib and pandas
- change matplotlib style (optional)
- Create example DataFrame
- Create the figure and pair axes -
f, axes = plt.subplots(1,2, figsize=(10,5))- Set the figure size to 10 - width and 5 - height.
- Plot a pie chart for each column
- Add values
- Add labels
- Add legend to the bottom of the pie chart
- Add title to the pie plot
More information can be found: DataFrame.plot - secondary_y
Data
Suppose we have the next data to plot a pie plot with matplotlib:
| first | second | |
|---|---|---|
| a | 2.353856 | 2.092165 |
| b | 1.502213 | 1.856740 |
| c | 1.491778 | 1.586964 |
| d | 2.310574 | 0.091085 |
| e | 1.991505 | 0.821967 |
Example
import matplotlib.pyplot as plt
plt.style.use('ggplot')

import pandas as pd
df = pd.DataFrame(3 * np.random.rand(5, 2), index=['a', 'b', 'c', 'd', 'e'], columns=['first', 'second'])

f, axes = plt.subplots(1,2, figsize=(10,5))
for ax, col in zip(axes, df.columns):
	df[col].plot(kind='pie', autopct='%.2f', labels=df.index,  ax=ax, title=col, fontsize=10)
	ax.legend(loc=3)

plt.show()
Output


