We can use secondary axes to combine bar and line plots on the same chart with Matplotlib and Pandas.
This short guide explains how to plot a Pandas DataFrame with both a bar chart and a line plot on the same chart.
Steps to Plot Bar and Line on the Same Chart
- Import the necessary libraries (
pandasandmatplotlib). - Create or load a DataFrame containing your data.
- Use the Pandas
.plot()method to create the bar chart. - Add the line plot using a secondary Y-axis to distinguish its scale (optional if scales differ).
- Customize the chart (titles, legends, axis labels, etc.).
Example Data
Consider the following dataset, where we have monthly revenue and profit values:
| Month | Revenue | Profit |
|---|---|---|
| January | 1000 | 200 |
| February | 1200 | 250 |
| March | 1100 | 300 |
| April | 1400 | 350 |
import pandas as pd
import matplotlib.pyplot as plt

# Example data
data = {
    'Month': ['January', 'February', 'March', 'April'],
    'Revenue': [1000, 1200, 1100, 1400],
    'Profit': [200, 250, 300, 350]
}

df = pd.DataFrame(data)
data:
| Month | Revenue | Profit | |
|---|---|---|---|
| 0 | January | 1000 | 200 |
| 1 | February | 1200 | 250 |
| 2 | March | 1100 | 300 |
| 3 | April | 1400 | 350 |
Combine bar and line plots
Below is an example to create a combined bar and line chart:
import pandas as pd
import matplotlib.pyplot as plt

# Example data
data = {
    'Month': ['January', 'February', 'March', 'April'],
    'Revenue': [1000, 1200, 1100, 1400],
    'Profit': [200, 250, 300, 350]
}

df = pd.DataFrame(data)

fig, ax = plt.subplots(figsize=(6, 4))
df.plot(x='Month', y='Revenue', kind='bar', color='skyblue', ax=ax, label='Revenue')

df.plot(x='Month', y='Profit', kind='line', color='orange', ax=ax.twinx(), label='Profit')

ax.set_title('Revenue and Profit by Month')
ax.set_xlabel('Month')
ax.set_ylabel('Revenue ($)')
ax.legend(loc='upper center')

plt.tight_layout()
plt.show()
Explanation of the Code
- Bar Chart: The
kind='bar'argument indf.plot()generates a bar chart for revenue. - Line Chart with Secondary Axis: Using
ax.twinx()allows the line plot (profit) to use a secondary Y-axis. - Customization: Titles, labels, and legends are added for clarity.
Output
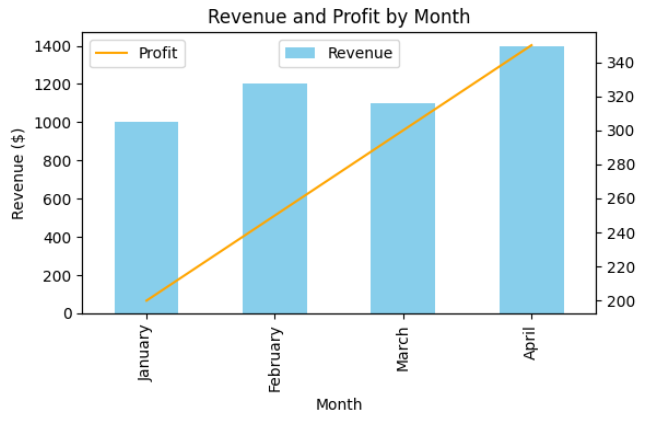
The resulting chart combines a bar plot (Revenue) and a line plot (Profit), making it easy to compare trends between the two metrics, even when they have different scales:

Example: Multiple Bar Charts with single Line chart:
df = pd.DataFrame({
    'month': ['jan', 'feb', 'mar', 'apr', 'may', 'jun', 'jul', 'aug', 'sep', 'oct', 'nov', 'dec'],
    '2023': [1, 2, 3, 3, 5, 6, 7, 1, 9, 4, 5, 6],
    '2024': [1, 7, 4, 6, *[float('nan')]* 8],
    '2025': [7, 5, 9, 4, 2, 7, 5, 2, 3, 4, 10, 1]})

df['month'] = pd.to_datetime(df['month'], format='%b')

fig, ax = plt.subplots(1, facecolor='white')
df.plot(y='2025', linestyle='-', marker='.', ax=ax, color='red')
df.plot(x='month', y=['2023', '2024'], kind='bar', ax=ax, title='Monthly sells and estimate')

ax.set(xticklabels=pd.to_datetime([dt.get_text() for dt in ax.get_xticklabels()]).strftime('%b'));
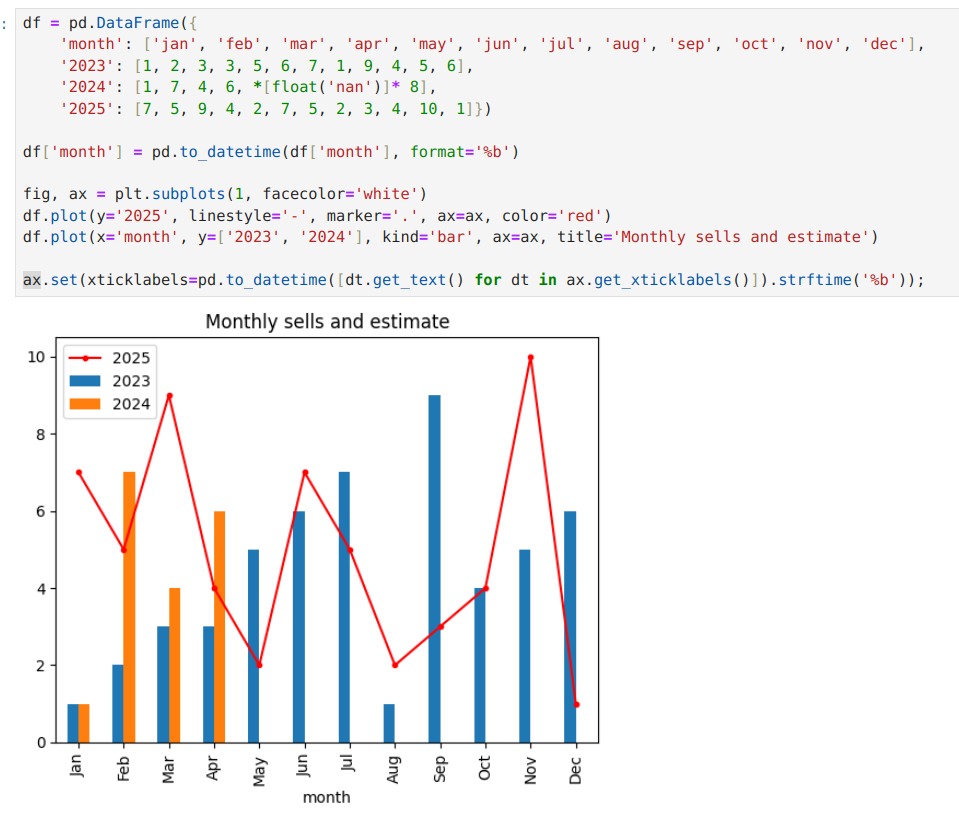
Result:


