


This post explains why and to control the date format in Pandas bar plots.
When plotting a bar chart in Pandas with a date column, you may notice that the date format changes automatically. This happens because Matplotlib (which Pandas uses for plotting) automatically formats dates for better readability. However, in some cases, this formatting may not be desirable.
Why does the date format change?
- Pandas internally uses Matplotlib for plotting, and Matplotlib applies automatic date formatting.
- It often converts dates to concise tick labels, showing only year or month depending on the range.
- This behavior may truncate full dates or change their display unexpectedly.
Steps to customize date format in Pandas bar plots
- Convert the date column to
datetimeformat usingpd.to_datetime() - Create a bar plot using
df.plot(kind='bar')- or
- Use Matplotlib’s date formatters to customize the display
- Rotate x-axis labels for better readability
More information can be found: Matplotlib Date Formatting
Data: Monthly Sales Report
We will generate simple data for plotting:
| 0 | |
|---|---|
| 2025-01-31 | 2.091076 |
| 2025-02-28 | 1.404060 |
| 2025-03-31 | 0.719500 |
| 2025-04-30 | 1.244072 |
| 2025-05-31 | -0.903726 |
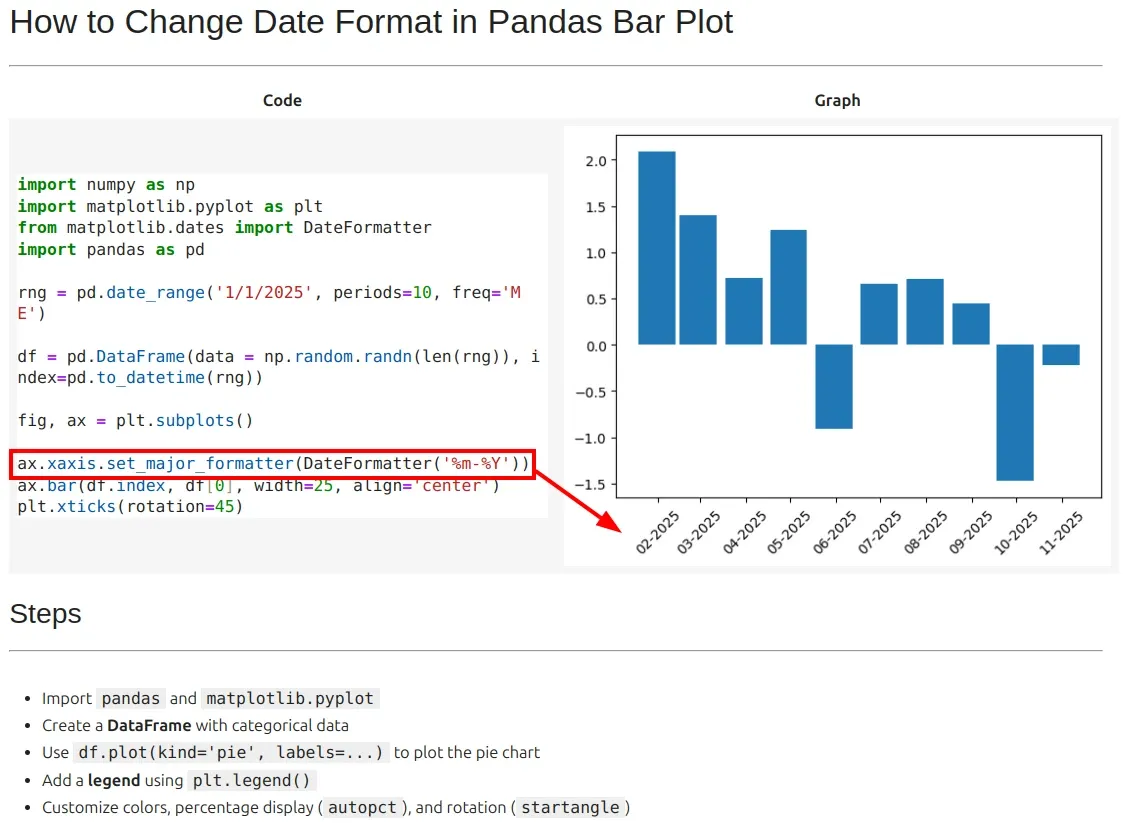
Example: Fixing Date Format in Bar Plot
import numpy as np
import matplotlib.pyplot as plt
from matplotlib.dates import DateFormatter
import pandas as pd

rng = pd.date_range('1/1/2025', periods=10, freq='ME')

df = pd.DataFrame(data = np.random.randn(len(rng)), index=pd.to_datetime(rng))

fig, ax = plt.subplots()

ax.xaxis.set_major_formatter(DateFormatter('%m-%Y'))
ax.bar(df.index, df[0], width=25, align='center')
plt.xticks(rotation=45)
Output
- The x-axis now correctly displays full dates (
YYYY-MM-DD). - Labels are rotated to prevent overlap.
- The date format is fixed using
mdates.DateFormatter().
Example 2: Customize dates with strftime
import pandas as pd
import matplotlib.pyplot as plt
import numpy as np

start = pd.to_datetime("1-1-2025")
index = pd.date_range(start, periods= 180)
df = pd.DataFrame({'A' : np.random.random(180), 'B' : np.random.random(180)}, index=index)

df_months = df.resample("ME").sum()

fig, ax = plt.subplots()
df_months.plot(kind="bar", figsize=(16,5), stacked=True, ax=ax)

# format xtick-labels with list comprehension
ax.set_xticklabels([x.strftime("%Y-%m") for x in df_months.index], rotation=45)
plt.show()
Customizing the Date Format
If you want to display only the month and year:
ax.xaxis.set_major_formatter(mdates.DateFormatter('%b %Y')) # Example: "Jan 2023"
If you want only the month name:
ax.xaxis.set_major_formatter(mdates.DateFormatter('%B')) # Example: "January"