


Creating plots in Matplotlib, controlling the figure size could be essential for readability.
Matplotlib provides several ways to change the size of figures, both locally for a single plot and globally for all plots in a session.
The most common approaches are:
- Passing
figsizewhen creating a figure - Resizing an existing figure with
set_size_inches() - Setting global defaults with
rcParams
Steps to change figure size
- Import matplotlib
- Create a figure using
plt.figure()orplt.subplots() - Specify the desired size in inches using
figsize - (Optional) Modify an existing figure using
set_size_inches() - (Optional) Set global defaults using
rcParams
Common ways to change figure size
1. Set size when creating the figure
This is the most common and recommended way.
import matplotlib.pyplot as plt

fig, ax = plt.subplots(figsize=(10, 5))
ax.plot([1, 2, 3, 4], [10, 20, 15, 25])

plt.show()
Here, figsize=(10, 5) means:
- 10 inches wide
- 5 inches tall
source: matplotlib.pyplot.figure
figsize(float, float), default: rcParams["figure.figsize"] (default: [6.4, 4.8])
Width, height in inches.
2. Resize an existing figure
If the figure already exists, you can resize it afterward.
import matplotlib.pyplot as plt

fig, ax = plt.subplots()
ax.plot([1, 2, 3], [4, 6, 5])

fig.set_size_inches(12, 6)

plt.show()
This is useful when you need to adjust layout dynamically.
3. Set global default figure size
To apply the same size to all plots in a session, use rcParams.
import matplotlib.pyplot as plt

plt.rcParams["figure.figsize"] = (8, 4)

plt.plot([1, 2, 3], [3, 7, 5])
plt.show()
This changes the default size for all subsequent figures. You can also reset it later:
plt.rcParams["figure.figsize"] = plt.rcParamsDefault["figure.figsize"]
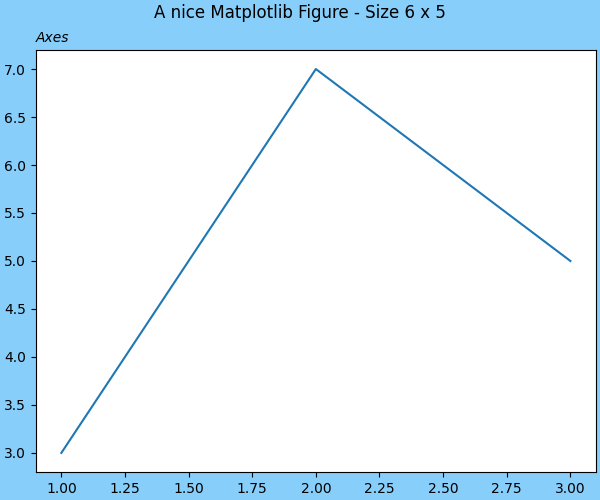
Change size and save the plot to file
Finally we can saved the resized plot by:
import matplotlib.pyplot as plt

fig = plt.figure(figsize=(6, 5), facecolor='lightskyblue',
                 layout='constrained')
fig.suptitle('A nice Matplotlib Figure - Size 6 x 5')

ax = fig.add_subplot()
plt.plot([1, 2, 3], [3, 7, 5])
a = ax.set_title('Axes', loc='left', fontstyle='oblique', fontsize='medium')

name = 'how-to-change-figure-size-in-matplotlib'
fig.savefig(f'/home/vanx/Downloads/{name}')
Notes on figsize and DPI
Figure size in Matplotlib depends on:
figsize— size in inchesdpi— dots (pixels) per inch
The final pixel size is:
width_pixels = figsize_width × dpi
height_pixels = figsize_height × dpi
Changing dpi scales all visual elements proportionally, while changing figsize changes the canvas size.
When to use each method
- Use
figsizeinplt.subplots()for most plots - Use
set_size_inches()for dynamic resizing - Use
rcParamsfor consistent styling across many plots or notebooks