To visualize multiple DataFrames in subplots, you can follow these steps:
- Create multiple DataFrames – Each dataset should contain relevant data
- Initialize a figure and axes – Use
plt.subplots()to create a grid layout - Plot each DataFrame separately – Assign each DataFrame to a specific subplot
- Customize plots – Add titles, labels, and legends for clarity
(1) Plot Single DataFrame in Subplots
df.plot(subplots=True, layout=(1,2))
(2) Plot Multiple DataFrames in Subplots
fig, axes = plt.subplots(1, 2, figsize=(12, 5))
Steps to Plot Multiple DataFrames in Subplots
- Import
pandasandmatplotlib - Create multiple DataFrames with sample data
- Initialize a figure and axes using
plt.subplots() - Assign each DataFrame plot to a specific subplot
- Customize the figure with labels, titles, and legends
More details can be found in the Matplotlib Subplots Documentation.
Data
| Month | Sales_A | Sales_B |
|---|---|---|
| January | 100 | 90 |
| February | 120 | 80 |
| March | 80 | 95 |
| April | 90 | 100 |
| May | 110 | 85 |
Example – Plot Multiple DataFrames in Subplots
import pandas as pd
import matplotlib.pyplot as plt

# Create sample DataFrames
df1 = pd.DataFrame({'Month': ['January', 'February', 'March', 'April', 'May'],
                    'Sales_A': [100, 120, 80, 90, 110]})

df2 = pd.DataFrame({'Month': ['January', 'February', 'March', 'April', 'May'],
                    'Sales_B': [90, 80, 95, 100, 85]})

# Create subplots
fig, axes = plt.subplots(1, 2, figsize=(12, 5))

# Plot DataFrame 1
df1.plot(x='Month', y='Sales_A', kind='bar', ax=axes[0], color='skyblue', legend=False)
axes[0].set_title("Store A Sales")

# Plot DataFrame 2
df2.plot(x='Month', y='Sales_B', kind='bar', ax=axes[1], color='lightcoral', legend=False)
axes[1].set_title("Store B Sales")

plt.tight_layout()
plt.show()
Output
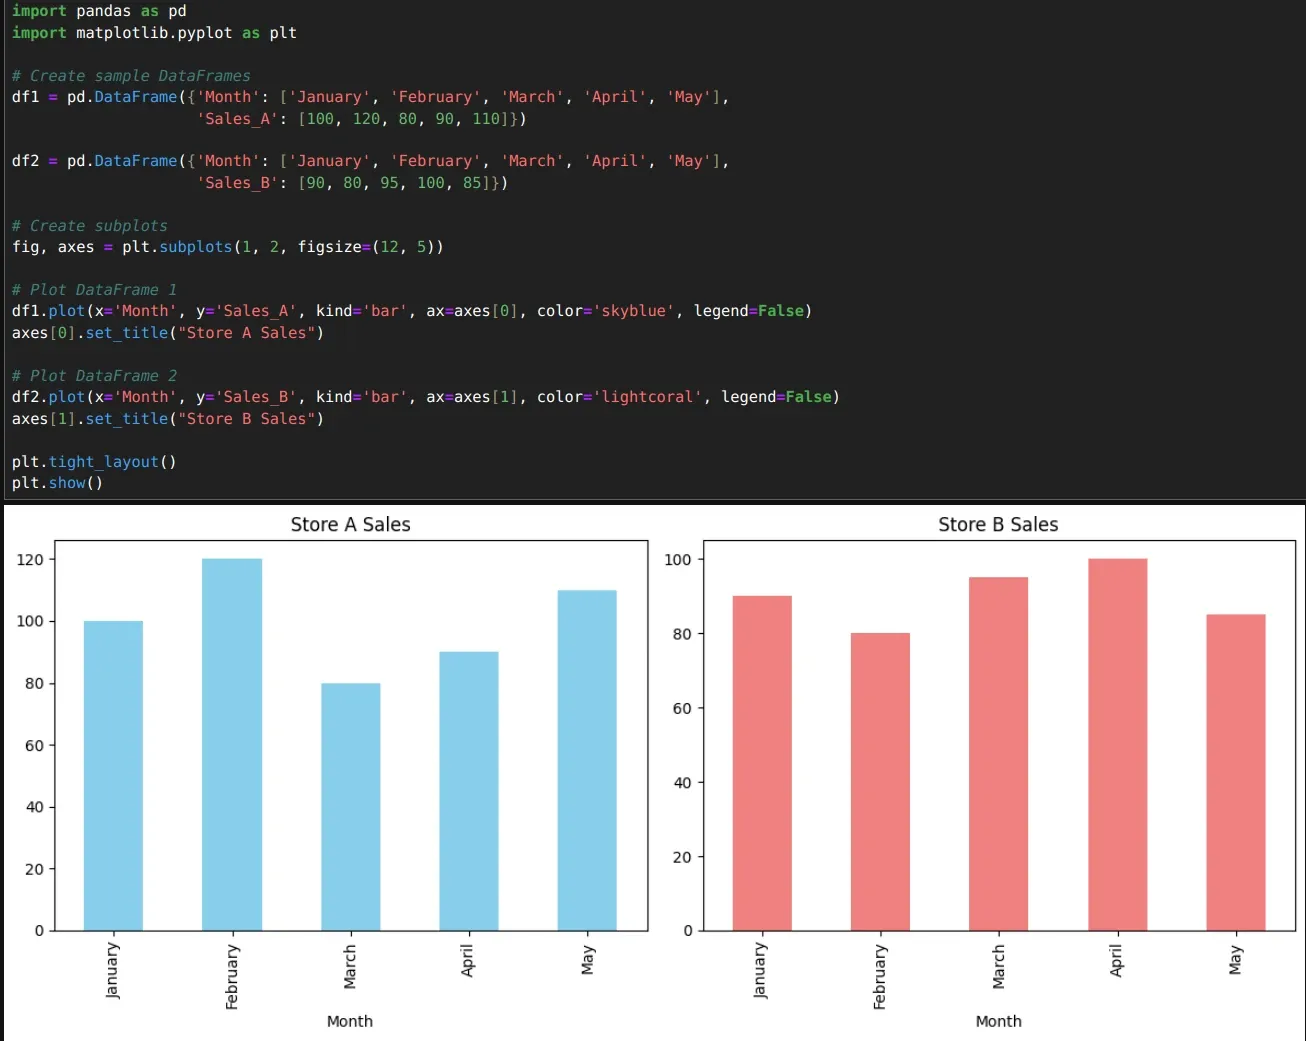
The above code generates a subplot with two bar charts, displaying sales data from different stores.

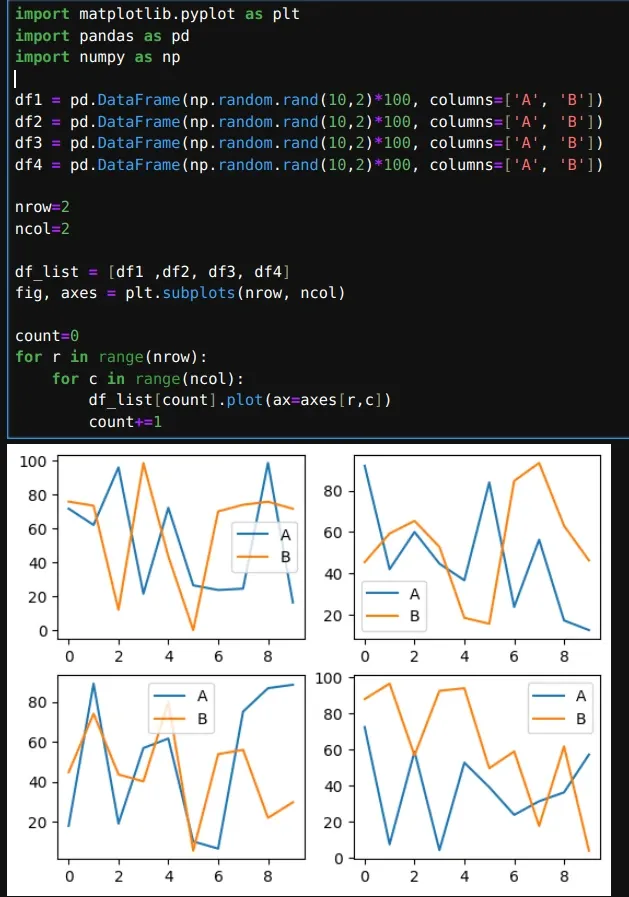
Example 2 – Plot Multiple DataFrames in Subplots with iteration
import matplotlib.pyplot as plt
import pandas as pd
import numpy as np

df1 = pd.DataFrame(np.random.rand(10,2)*100, columns=['A', 'B'])
df2 = pd.DataFrame(np.random.rand(10,2)*100, columns=['A', 'B'])
df3 = pd.DataFrame(np.random.rand(10,2)*100, columns=['A', 'B'])
df4 = pd.DataFrame(np.random.rand(10,2)*100, columns=['A', 'B'])

nrow=2
ncol=2

df_list = [df1 ,df2, df3, df4]
fig, axes = plt.subplots(nrow, ncol)

count=0
for r in range(nrow):
    for c in range(ncol):
        df_list[count].plot(ax=axes[r,c])
        count+=1
Output

When to Use Subplots?
- Comparing different datasets – Sales, stock prices, or population trends
- Multi-variable visualization – Plot multiple related features separately
- Custom layouts – Organize multiple charts in a single figure to avoid endless scrolling
- Better readability – Avoid cluttered plots by separating visuals and confusing colors


