


This article explores how to plot histograms for multiple features in a dataset using Seaborn and Matplotlib's gridspec.
Why Use Gridspec for Multiple Plots?
When dealing with multiple features, plotting individual histograms separately can be inefficient. Using gridspec helps:
- Organize multiple subplots into a grid layout
- Maintain consistent figure sizes
- Improve readability by keeping plots aligned
Steps to Create Multiple Histograms for Features
- Import required libraries (
matplotlib,seaborn,pandas) - Load the credit card fraud dataset - source: creditcard.csv
- Extract the relevant feature columns
- Create a grid layout using
gridspec.GridSpec - Loop through each feature and plot histograms for fraudulent (Class=1) and non-fraudulent (Class=0) transactions
More information can be found: Matplotlib GridSpec
Dataset: Credit Card Fraud Transactions
The dataset contains transactions with multiple features (V1–V28) extracted from PCA transformation. The Class column indicates whether a transaction is fraudulent (1) or legitimate (0).
import pandas as pd
data = pd.read_csv("creditcard.csv.zip")
print("Shape of input data: "+str(data.shape))
data.head()
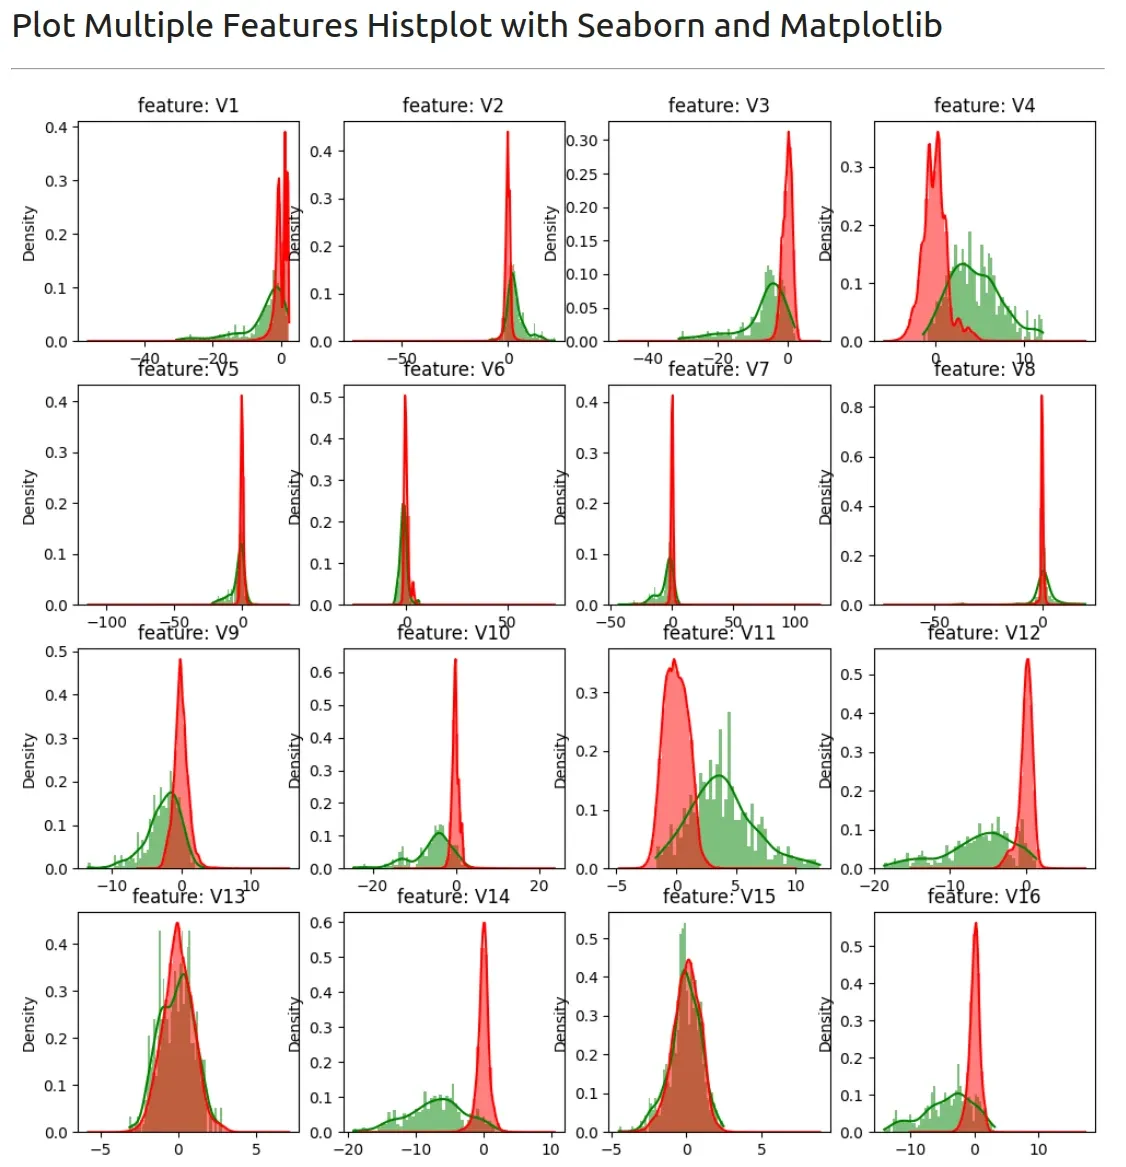
Example: Plot Histograms for Fraud and Non-Fraud Transactions
import matplotlib.pyplot as plt
import seaborn as sns
import matplotlib.gridspec as gridspec
%matplotlib inline

v_features = data.iloc[:,1:29].columns

plt.figure(figsize=(12,8*4))
gs = gridspec.GridSpec(7, 4)
for i, cn in enumerate(data[v_features]):
    ax = plt.subplot(gs[i])
    sns.histplot(data[cn][data.Class == 1], color="green", label="100% Equities", kde=True, stat="density", linewidth=0, bins=50)
    sns.histplot(data[cn][data.Class == 0], color="red", label="100% Equities", kde=True, stat="density", linewidth=0, bins=50)
    ax.set_xlabel('')
    ax.set_title('feature: ' + str(cn))
plt.show()
Output
- Histograms are displayed for each feature (
V1–V28). - Red color represents fraudulent transactions (
Class = 1). - Blue color represents non-fraudulent transactions (
Class = 0). - Grid layout ensures all features are visible and aligned.
Customizations
- Adjust
bins=50for a smoother or more detailed histogram - Modify
figsize=(12, 32)to increase/decrease plot size - Use
alpha=0.5insns.histplot()for transparent overlapping bars
sns.histplot(train_df[cn][train_df.Class == 1], bins=50, color='red', alpha=0.5)
sns.histplot(train_df[cn][train_df.Class == 0], bins=50, color='blue', alpha=0.5)