To plot two variables on two sides of Y-axes, we can plot in two steps:
- plot first variable on the main y-axis - left one
- plot the second variable on the secondary y-axis - right one
Steps to plot 2 variables
- Import matplotlib library
- Create DataFrame with correlated data
- Create the figure and axes object -
fig, ax = plt.subplots() - Plot the first variable on x and left y axes
- Plot the second variable on x and secondary y axes
More information can be found: DataFrame.plot - secondary_y
Data
| day | temp | humidity | |
|---|---|---|---|
| 0 | 1 | 9 | 0.89 |
| 1 | 2 | 8 | 0.86 |
| 2 | 3 | 6 | 0.54 |
| 3 | 4 | 13 | 0.73 |
| 4 | 5 | 10 | 0.45 |
Example
import pandas as pd
import matplotlib.pyplot as plt
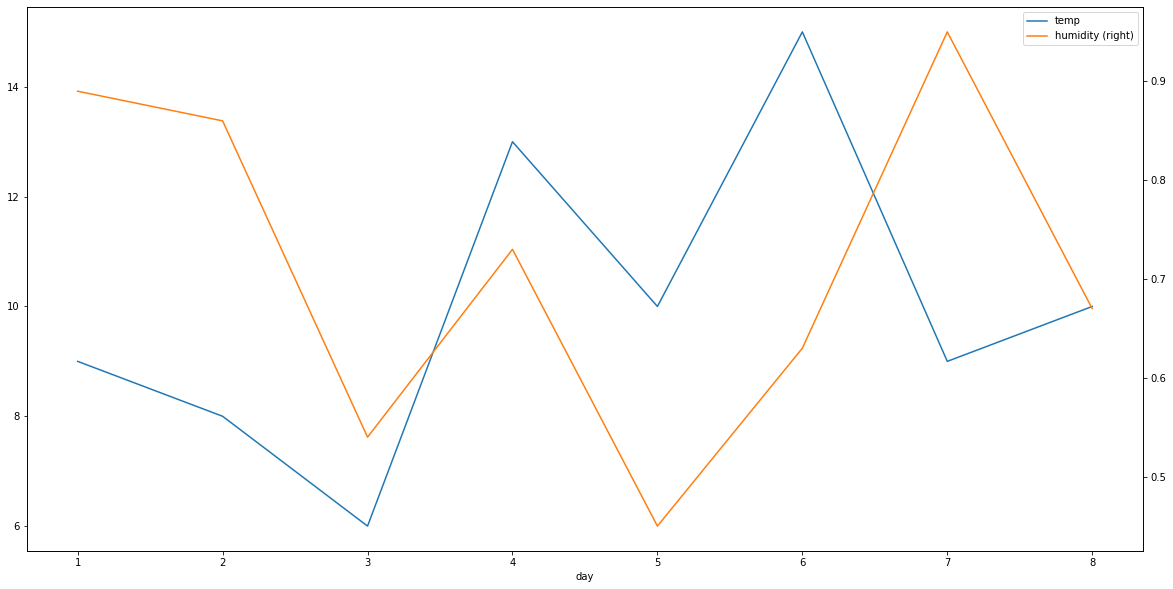
df = pd.DataFrame(data={'day': [1, 2, 3, 4, 5, 6, 7, 8],
'temp': [9, 8, 6, 13, 10, 15, 9, 10],
'humidity': [0.89, 0.86, 0.54, 0.73, 0.45, 0.63, 0.95, 0.67]})
fig, ax = plt.subplots(figsize=(20,10))
df.plot(x = 'day', y = 'temp', ax = ax)
df.plot(x = 'day', y = 'humidity', ax = ax, secondary_y = True)
Output