In this short article we will see how to plot Unix timestamp in Pandas and Python.
To plot readable dates we will do a basic conversion of Unix timestamp to date in Pandas. To find more detailed examples visit How to Convert Unix Time to Date in Pandas
Setup
Let's create a DataFrame with Unix timestamp information:
dict = {'ts': {0: 1655822072.437469,
  1: 1655815574.333629,
  2: 1655797456.516109,
  3: 1655743965.358579,
  4: 1655712623.707739},
 'reply_count': {0: 2.0, 1: 3.0, 2: 3.0, 3: 2.0, 4: None}}

pd.DataFrame(dict)
Final data:
| ts | reply_count | |
|---|---|---|
| 0 | 1655822072.437469 | 2.0 |
| 1 | 1655815574.333629 | 3.0 |
| 2 | 1655797456.516109 | 3.0 |
| 3 | 1655743965.358579 | 2.0 |
| 4 | 1655712623.707739 | NaN |
Step 1: Convert Unix timestamp to date
First we will convert the Unix time to Pandas datetime by:
df['date'] = pd.to_datetime(df['date'],unit='s')
The result will be timestamp:
1655822072.437469
to datetime:
DatetimeIndex(['2022-06-21 14:34:32.437469006',
               '2022-06-21 12:46:14.333628893',
               '2022-06-21 07:44:16.516108990'],
              dtype='datetime64[ns]', freq=None)
Step 2: Convert datetime to readable date
Next we will extract readable dates from the datetime in order to plot them.
We can get any date format(if needed consult with: How to Convert Unix Time to Date in Pandas.
For simplicity we will use day:
df['day'] = df['date'].dt.day
This will create new column which has day of month for a given time stamp
Step 3: Plot Unix timestamp as index
We can plot a given value for each day. In DataFrame above we have pairs of date and quantity:
2 - 2022-06-21
3 - 2022-06-21
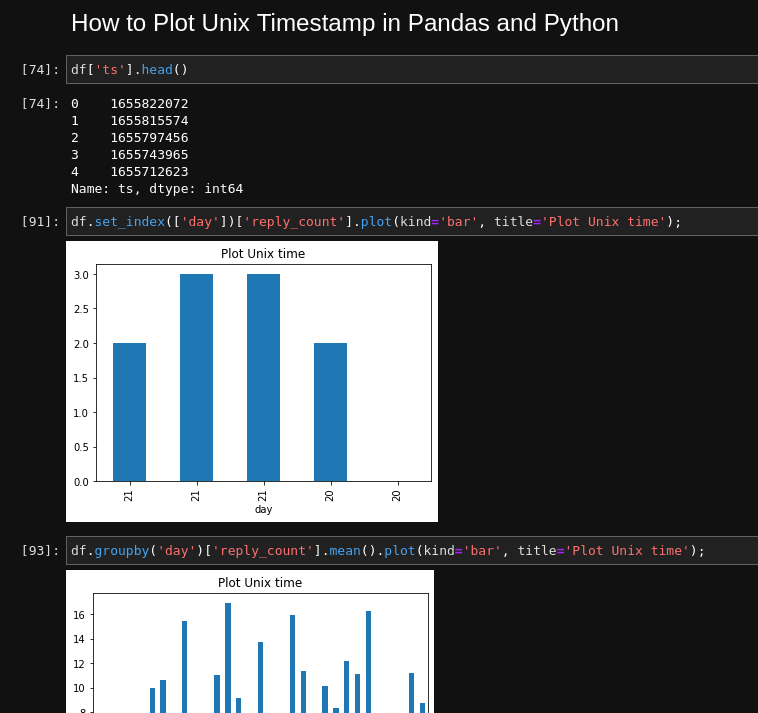
To plot this information we can set the day or date column as index. Then select the column which needs to be plotted by:
df.set_index(['day'])['reply_count'].plot(title='Plot Unix time');
We can select also the type of the plot by kind='bar'.
Step 4: Group by Unix timestamp date and plot
Finally suppose we would like to get statistic per each period: day, week, month etc.
For this purpose we can convert the datetime to each time unit. We need also to group by each unit.
Finally we need to select a column and function which should be applied like:
count()sum()mean()
df.groupby('day')['reply_count'].count().plot(kind='bar', title='Plot Unix time');