To customize a Pandas pie plot with labels and a legend, we need to follow these steps:
- Use
DataFrame.plot(kind='pie')to generate the pie chart - Add labels to show category names
- Customize the legend to display labels properly
- Adjust additional properties like:
- colors
- autopct
- startangle
Steps to Customize a Pie Chart
- Import
pandasandmatplotlib.pyplot - Create a DataFrame with categorical data
- Use
df.plot(kind='pie', labels=...)to plot the pie chart - Add a legend using
plt.legend() - Customize colors, percentage display (
autopct), and rotation (startangle)
More information can be found: DataFrame.plot - pie chart
Data
| Category | Sales | |
|---|---|---|
| 0 | Electronics | 4500 |
| 1 | Clothing | 3000 |
| 2 | Groceries | 5000 |
| 3 | Furniture | 2500 |
Example
import pandas as pd
import matplotlib.pyplot as plt

# Create DataFrame
df = pd.DataFrame({'Category': ['Electronics', 'Clothing', 'Groceries', 'Furniture'],
                   'Sales': [4500, 3000, 5000, 2500]})

# Set 'Category' as index
df.set_index('Category', inplace=True)

# Create Pie Chart
fig, ax = plt.subplots(figsize=(8, 8))
df.plot(kind='pie', y='Sales', autopct='%1.1f%%', startangle=140, legend=False, ax=ax)

# Add legend
plt.legend(labels=df.index, title="Product Categories", loc="upper right")

# Show plot
plt.show()
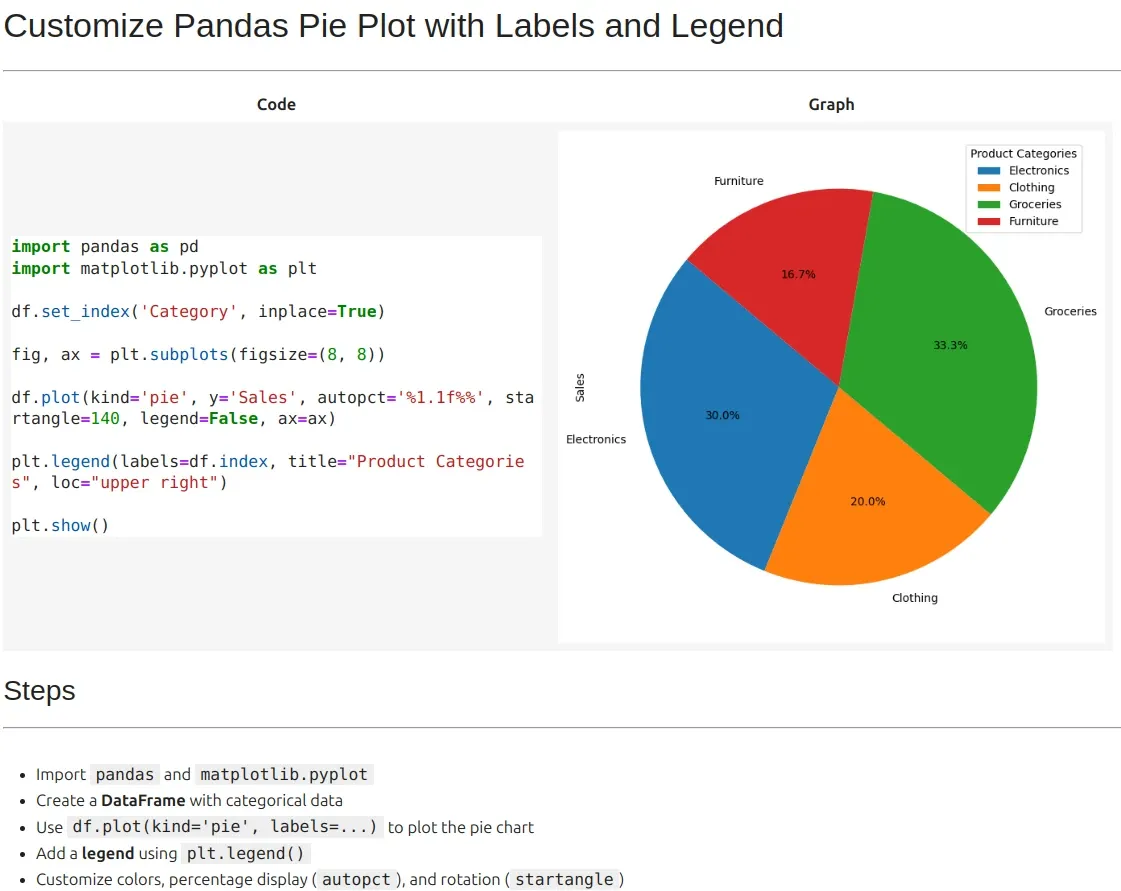
Output
This will generate a pie chart where:
- Labels are shown with percentages
- Legend is displayed on the top right
- Pie is rotated for better readability