


1. Overview
In this quick tutorial, we’ll discuss how to change the tick frequency datetime labels for Matplotlib plots.
We'll look into several examples covering multiple aspects of tick frequency and datetime labels in Matplotlib.
2. Setup
For this tutorial we are going to generate a DataFrame with random datetime data:
import pandas as pd
from pandas.util.testing import makeTimeDataFrame

df = makeTimeDataFrame()
df.head()
Data to plot:
| A | B | C | D | |
|---|---|---|---|---|
| 2000-01-03 | 0.113495 | -0.304689 | 1.298162 | -0.610516 |
| 2000-01-04 | -0.487032 | -0.610312 | 0.042107 | -2.951114 |
| 2000-01-05 | 1.383193 | -0.874822 | 0.410601 | -0.414010 |
| 2000-01-06 | -0.710621 | 0.149063 | 0.321933 | 0.379205 |
| 2000-01-07 | 0.636333 | -0.701255 | -0.003180 | 1.615974 |
To learn more about creating DataFrames for tests in Pandas refer to: How to Easily Create Dummy DataFrame with Test Data?
3. Preparation for datetime plot (optional)
Before starting with the plot we need to ensure two things in order to plot datetime correctly:
3.1. Set datetime as index
Dataframe above has a datetime index by default. If this is not the case for you may need to convert datetime column to index by:
df.set_index('date', inplace = True)
After that you can plot datetime for the updated DataFrame by using method plot()
3.2. Convert the index to date
Depending on your index type you may get different or unexpected results.
To convert the index to date you can use:
df.index = pd.to_datetime(df.index).date
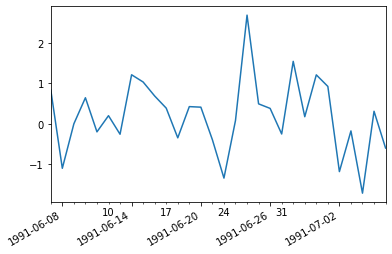
Otherwise you will plot wrong dates as x label - below the code generates wrong datetime plot:
import matplotlib.dates as mdates
import matplotlib.pylab as plt

ax = df['B'].plot()
ax.xaxis.set_major_locator(mdates.DayLocator(interval=6))
ax.xaxis.set_major_formatter(mdates.DateFormatter('%Y-%m-%d'))
plt.gcf().autofmt_xdate()

plt.show()
instead of 2000-01-03 we get 1991-06-08 etc:
4. Change the DateТime Tick Frequency on X labels for Matplotlib
Finally, let's plot and change the tick frequency on the X labels for Matplotlib. Once we ensure that the index is set and has the correct type we can plot the datetime.
To plot single column - B we can do (for multiple columns change to - df[['A', 'B']] :
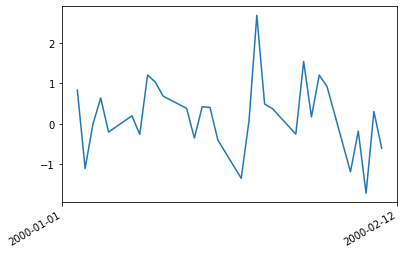
df['B'].plot()
The default ticks are not very practical :
4.1. Change Tick Frequency
To change the tick frequency we need to use the next code:
import matplotlib.dates as mdates
import matplotlib.pylab as plt

ax = df['B'].plot()
ax.xaxis.set_major_locator(mdates.DayLocator(interval=6))
ax.xaxis.set_major_formatter(mdates.DateFormatter('%Y-%m-%d'))
plt.gcf().autofmt_xdate()

plt.show()
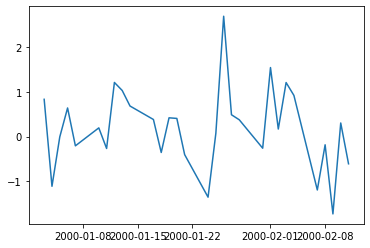
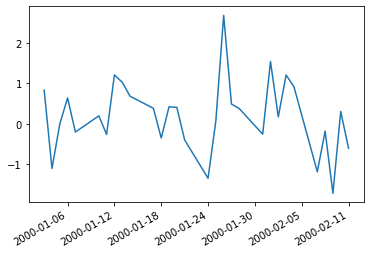
There is another date interval, date format and rotation of the labels:
4.2. Change Tick Frequency interval - daily, weekly, monthly etc
We can control several options when we change the tick frequency - first of them is the interval. There are several possible types of intervals:
- mdates.DayLocator()
- mdates.WeeklyLocator()
- mdates.MonthLocator()
- mdates.HourLocator()
- mdates.YearLocator()
To learn more about different types of Locators please check this article: matplotlib.dates.
You can also change the number of the intervals by providing: interval=6.
Example for weeks and interval of 2:
ax = df['B'].plot()
ax.xaxis.set_major_locator(mdates.WeekdayLocator(interval=2))
ax.xaxis.set_major_formatter(mdates.DateFormatter('%Y-%m-%d'))
plt.gcf().autofmt_xdate()

plt.show()
will weekly frequency:
And for months:
ax = df['B'].plot()
ax.xaxis.set_major_locator(mdates.MonthLocator(interval=2))
ax.xaxis.set_major_formatter(mdates.DateFormatter('%Y-%m-%d'))
plt.gcf().autofmt_xdate()

plt.show()
will monthly frequency:
4.3. Change format of the labels
You can also change the format of the dates in the X labels. The change can be done by:
ax.xaxis.set_major_formatter(mdates.DateFormatter('%Y-%m-%d'))
and more specifically by: mdates.DateFormatter('%Y-%m-%d').
For more information please check those two articles:
4.4. Change the X labels rotation
You can set a rotation angle by specific number:
plt.gcf().autofmt_xdate(rotation=30)
or leave it automatically:
plt.gcf().autofmt_xdate()
5. Full Code of Change Datetime Ticks Frequency
Finally let's see the full code:
import pandas as pd
from pandas.util.testing import makeTimeDataFrame

# create test DataFrame
df = makeTimeDataFrame()
import matplotlib.pyplot as plt
import matplotlib.dates as mdates

# Preprocessing
df.index = pd.to_datetime(df.index).date

# Plot
plt.figure()
plt.plot(df.index, df['A'])
ax = plt.gca()

# change tick frequency, format and rotation
ax.xaxis.set_major_locator(mdates.DayLocator(interval=5))
ax.xaxis.set_major_formatter(mdates.DateFormatter('%d-%m-%Y'))
plt.gcf().autofmt_xdate()
plt.show()
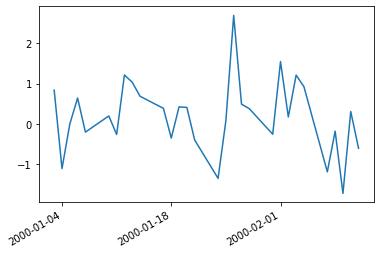
The result is:

6. Conclusion
In this article, we looked at several options to change the tick frequency for datetime plots in Matplotlib. We covered why wrong dates might appear in the plots.
What can be changed on the dates plot as X labels and data preprocessing.