


In this post you can learn how to import the axes module from the matplotlib library and add axes to matplotlib plot.
Steps to add axes in matplotlib
To import and add axes in matplotlib we can follow next steps:
- Import the matplotlib library
- Create a new figure and axes objects
- Plot your data on the axes
- Customize the plot by adding axis labels, a title, or other features
- Display the plot
Data
Data to be plot with axes in matplotlib:
| Name | Score | |
|---|---|---|
| 0 | Alice | 85 |
| 1 | Bob | 72 |
| 2 | Charlie | 90 |
| 3 | David | 80 |
Dataset 2:
| Name | Score | |
|---|---|---|
| 0 | Alice | 85 |
| 1 | Bob | 72 |
| 2 | Charlie | 90 |
| 3 | David | 80 |
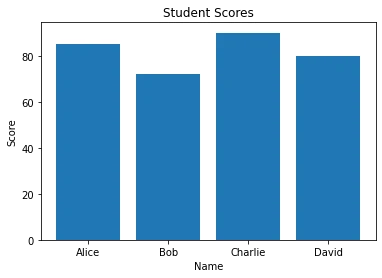
Example 1 - bar plot
import pandas as pd
import matplotlib.pyplot as plt

# create a sample dataframe
data = {'Name': ['Alice', 'Bob', 'Charlie', 'David'],
        'Score': [85, 72, 90, 80]}
df = pd.DataFrame(data)

# create a bar plot
fig, ax = plt.subplots()
ax.bar(df['Name'], df['Score'])

# set plot title and axis labels
ax.set_title('Student Scores')
ax.set_xlabel('Name')
ax.set_ylabel('Score')

# display plot
plt.show()
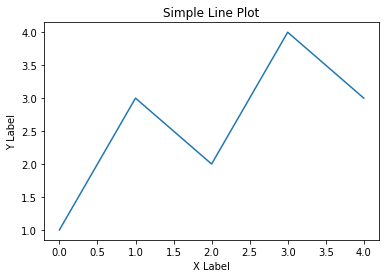
Example 2 - line plot
import matplotlib.pyplot as plt

# generate some data
x_data = [0, 1, 2, 3, 4]
y_data = [1, 3, 2, 4, 3]

# create a new figure and axes
fig, ax = plt.subplots()

# plot the data on the axes
ax.plot(x_data, y_data)

# customize the plot
ax.set_xlabel('X Label')
ax.set_ylabel('Y Label')
ax.set_title('Simple Line Plot')

# display the plot
plt.show()
Example 3 - dates
import pandas as pd
import matplotlib.pyplot as plt
import matplotlib.dates as mdates

# create a sample dataframe with dates and values
dates = pd.date_range(start='2022-01-01', end='2022-01-31')
values = [10, 12, 9, 13, 15, 14, 16, 18, 17, 20, 22, 24, 25, 23, 22, 21, 19, 20, 18, 16, 14, 12, 10, 9, 8, 7, 6, 5, 4, 3, 12]
data = {'Date': dates, 'Value': values}
df = pd.DataFrame(data)

# create a new figure and axes
fig, ax = plt.subplots()

# plot the data on the axes with dates as the x-axis
ax.plot(df['Date'], df['Value'])

# set the date format for the x-axis ticks
date_fmt = mdates.DateFormatter('%m/%d')
ax.xaxis.set_major_formatter(date_fmt)

# rotate the x-axis tick labels
plt.xticks(rotation=45)

# set the axis labels and title
ax.set_xlabel('Date')
ax.set_ylabel('Value')
ax.set_title('Line Plot with Dates')

# display the plot
plt.show()

Output