


To add text label to pandas plot we can use:
plt.text(1, 1,'my text',rotation=75)plt.text(x, 1, 'text', transform=trans)
Steps to add text label
- Import matplotlib library
- Create DataFrame
- Create the figure and axes object -
fig, ax = plt.subplots() - add lines
- add text
More information can be found: DataFrame.plot - secondary_y
Data
Suppose we have time series data where you would like to add lines and text to Pandas plot
| y | |
|---|---|
| 2019-07-01 | 1.000000 |
| 2019-07-02 | 1.079775 |
| 2019-07-03 | 1.165914 |
| 2019-07-04 | 1.258925 |
| 2019-07-05 | 1.359356 |
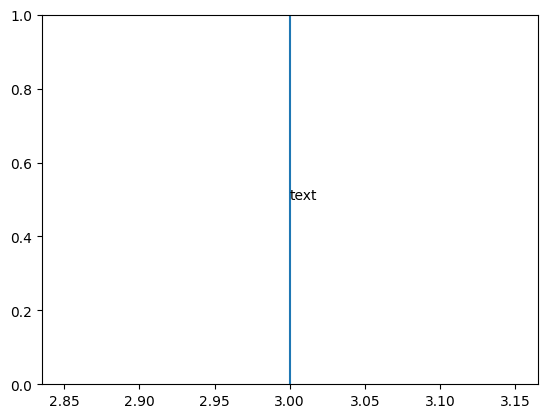
Example - add text to Pandas plot
import matplotlib.transforms as transforms
import matplotlib.pyplot as plt

fig, ax = plt.subplots()

x = 3
ax.axvline(x)
plt.text(x, .5, 'text')

plt.show()
Result
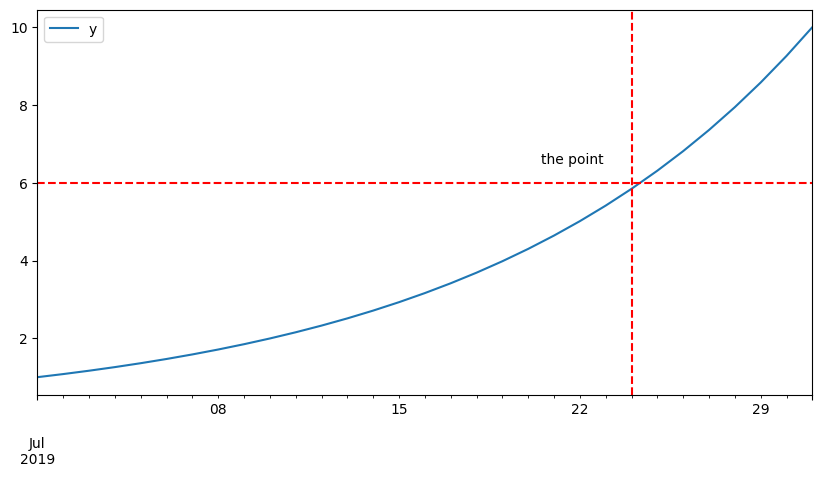
Example
import pandas as pd
import numpy as np
import matplotlib.pyplot as plt

df = pd.DataFrame(index=pd.date_range("2019-07-01", "2019-07-31"))
df["y"] = np.logspace(0, 1, num=len(df))

ax = df.plot(figsize=(10,5))

plt.text(0.65, 0.6,'the point', transform=ax.transAxes)

ax.axhline(6, color="red", linestyle="--")
ax.axvline("2019-07-24", color="red", linestyle="--")
Output
ValueError: Image size of 463x477 pixels is too large. It must be less than 2^16 in each direction.
To solve error: "ValueError: Image size of 467793x477 pixels is too large. It must be less than 2^16 in each direction." when you add text label to Pandas plot add: transform=ax.transAxes
So change the line
plt.text(0.65, 0.6,'the point')
to
plt.text(0.65, 0.6,'the point', transform=ax.transAxes)