


To add a vertical line on a time series plot in Pandas, we can use:
plt.axvline(x_position)ax.axvline(x, color='k', linestyle='--')
For horizontal line to be added to Pandas plot use:
ax.axhline(6, color="red", linestyle="--")
Steps to plot vertical or horizontal lines
- Import matplotlib library
- Create DataFrame with time series data
- Create the axes object -
ax = df.plot() - add verticle line
- add horizontal line
- add verticle lines based on range of dates
- add text to the verticle line
More information can be found: DataFrame.plot - secondary_y
Data
Sample time series data to be plot with Pandas
| Date | Rate | |
|---|---|---|
| 0 | 2024-12-18 | TBD |
| 1 | 2024-11-07 | TBD |
| 2 | 2024-09-18 | TBD |
| 3 | 2024-07-31 | TBD |
| 4 | 2024-06-12 | TBD |
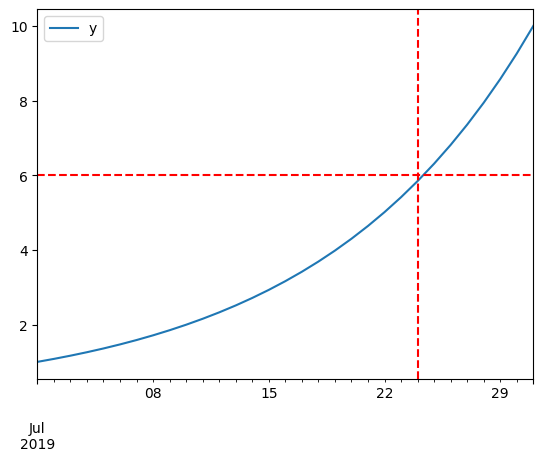
Example - add vertical line to Pandas plot
import pandas as pd
import numpy as np

df = pd.DataFrame(index=pd.date_range("2019-07-01", "2019-07-31"))
df["y"] = np.logspace(0, 1, num=len(df))

ax = df.plot()

ax.axhline(6, color="red", linestyle="--")
ax.axvline("2019-07-24", color="red", linestyle="--")
Output
Example - add vertical line and text to plot
import matplotlib.pyplot as plt
plt.figure(figsize=(30,10))
fig,ax = plt.subplots()

df_fed['Date'] = pd.to_datetime(df_fed['Date'])

df_2023 = df_fed[(df_fed['Date'] > pd.to_datetime('01/01/2022')) & (df_fed['Date'] < pd.to_datetime('01/01/2024'))]

xposition = df_2023['Date']
for i, xc in enumerate(xposition):
    ax.axvline(x=xc, color='r', linestyle='solid')
    plt.text(xc,1.1,df_2023['Rate'].iloc[i],rotation=0)
df.set_index('DateTime')['Rate_'].plot(rot=45, figsize=(30,10), title= 'Is EURUSD expected to rise?')
Output
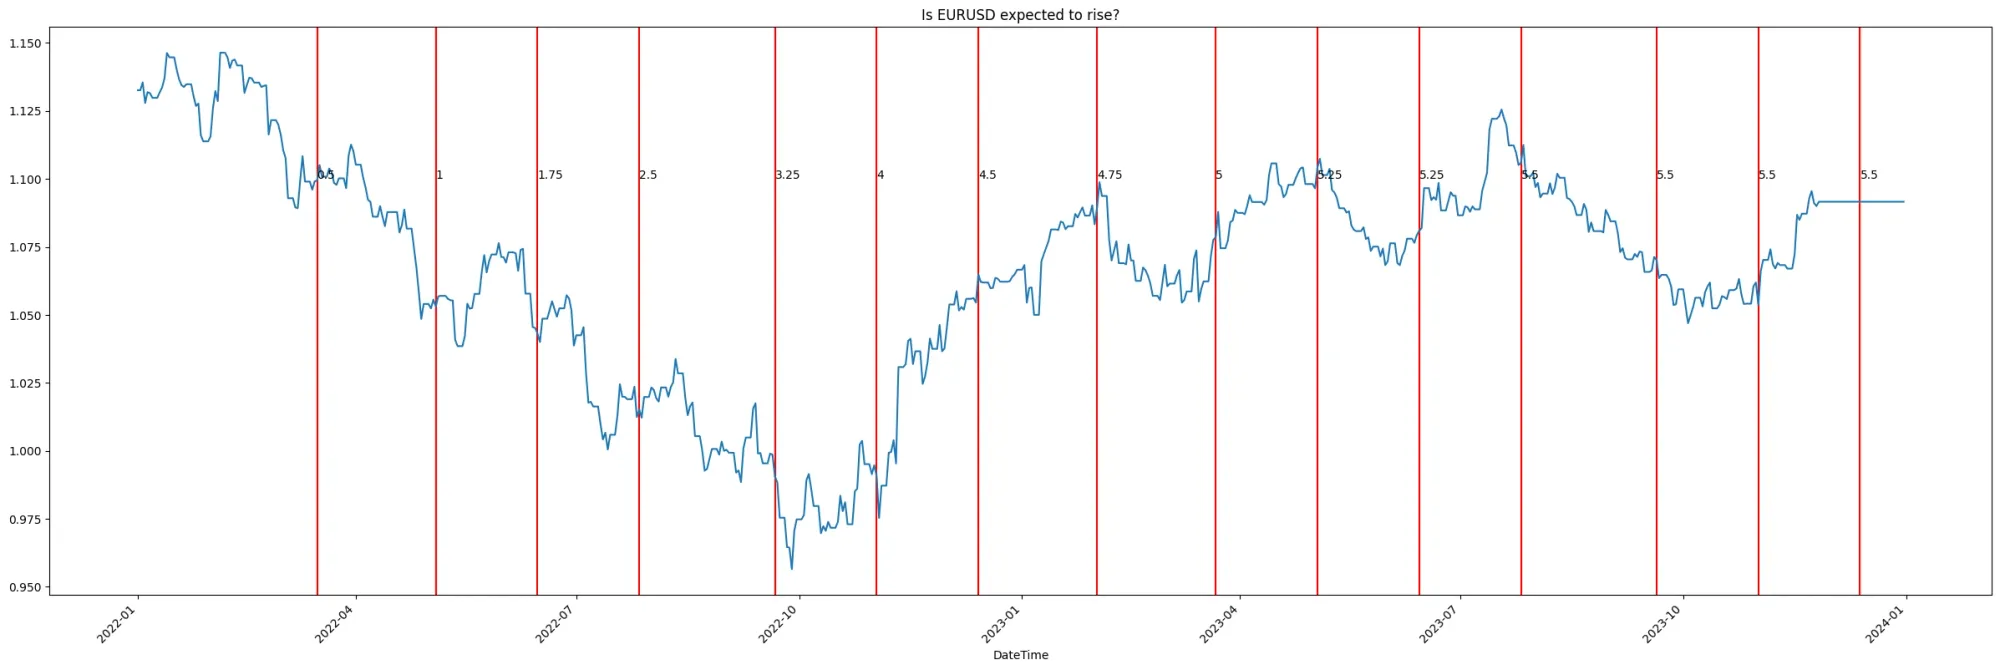
To find our more about this example please check: How to get currency data in Python?
Add multiple verticle lines
To add mulitple verticle lines to Pandas plot based on list of dates we can use:
year_range = pd.period_range(start='2000-01-01', end='2023-01-01', freq='Y')
year_range = pd.to_datetime(["%s-01-01 %s:00:00" % (y, (6 * h) % 24) for h, y in enumerate(range(2000, 2023, 4)) ])

xposition = [pd.to_datetime('2010-01-01'), pd.to_datetime('2015-12-31')]
xposition = year_range
for xc in xposition:
    ax.axvline(x=xc, color='r', linestyle='solid')