If you need to merge or combine two plots into single one in Pandas/Python you can use subplots. We will show two different examples:
- combine scatter and line plot
- merge two plots vertically
Steps to combine plots with Pandas
- Creates a dummy DataFrame (df) with random "data"
- Groups data by "date" and calculates the mean for each group.
- Creates columns with mean values (adjusted by +30% and -30%)
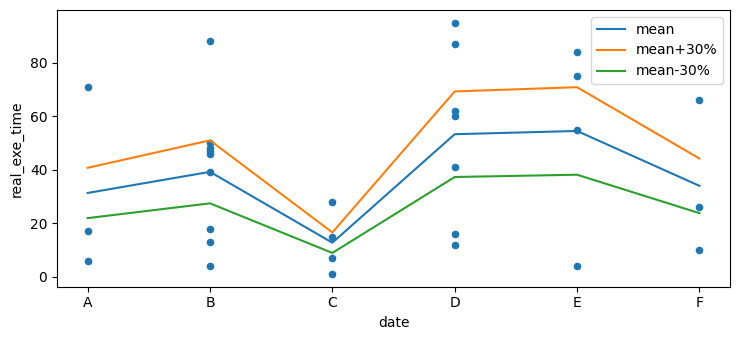
- Generates a scatter plot
df.plot.scatter() - Overlays a line plot on the same subplot with aggregated data
df_agg.plot() - Displays the combined plots using
plt.show().
Data
| date | real_exe_time | |
|---|---|---|
| 14 | A | 65 |
| 20 | A | 78 |
| 19 | A | 23 |
| 28 | A | 81 |
| 10 | A | 77 |
Example - single plot
import matplotlib.pyplot as plt
import pandas as pd
import numpy as np

n=30
df = pd.DataFrame({"date": np.random.choice(list("ABCDEF"), n), "real_exe_time": np.random.randint(1, 100, n)})
df = df.sort_values(by="date").reindex()

df_agg = df.groupby("date")["real_exe_time"].agg(mean="mean").reset_index()
df_agg["mean+30%"] = df_agg["mean"] * 1.3
df_agg["mean-30%"] = df_agg["mean"] * 0.7

ax = df.plot.scatter(x = 'date', y = 'real_exe_time')
df_agg.plot(x='date', y=['mean','mean+30%','mean-30%'], ax=ax)

plt.show()
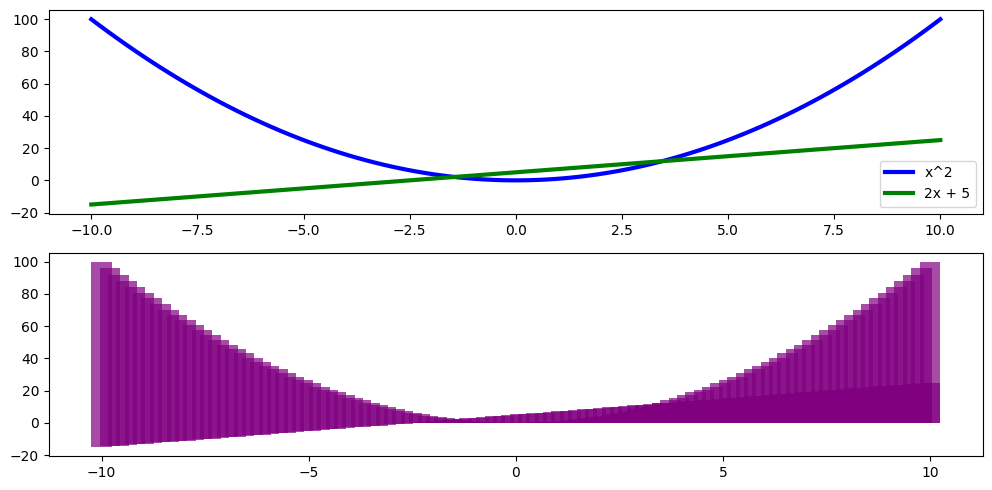
Output - combined output veritically
Example
import numpy as np
import matplotlib.pyplot as plt

plt.rcParams["figure.figsize"] = [7.50, 3.50]
plt.rcParams["figure.autolayout"] = True

x = np.linspace(-10, 10, 100)
y1 = x**2
y2 = 2 * x + 5

# Subplot for individual plots
plt.subplot(211)
plt.plot(x, y1, color='blue', lw=3, label='x^2')
plt.plot(x, y2, color='green', lw=3, label='2x + 5')
plt.legend()

# Extracting data from the line plots
X, Y = [], []
for lines in plt.gca().get_lines():
    for x, y in lines.get_xydata():
        X.append(x)
        Y.append(y)

# Sorting the extracted data
idx = np.argsort(X)
X = np.array(X)[idx]
Y = np.array(Y)[idx]

# Merged plot
plt.subplot(212)
plt.bar(X, Y, color='purple', alpha=0.7, width=0.5)

plt.show()
Below you can find the steps to combine two different plots into single one with Pandas:
- Uses
xvalues from -10 to 10. - Generates
y1asx^2andy2as2x + 5. - First subplot (
plt.subplot(211)) for individual line plots. - Plots
y1(blue line) andy2(green line) with different labels. - Extracts data points (
XandY) from the individual line plots. - Sorts extracted data points based on
Xvalues. - Second subplot (
plt.subplot(212)) for a merged bar plot. - Plots the sorted data as a bar plot (purple bars) in the second subplot.
- Displays the combined plot using
plt.show().
Output