


In this article, you can find out how to visualize high-dimentsional data with parallel coordinates in Python. In simple words you will see how to visualize and analyse datasets with tens or hundreads variables
What is High dimensional Interactive Plotting?
High-dimensional interactive plotting refers to: dynamic visualization techniques to explore and analyze datasets with a large number of dimensions.
Traditional static plots are overwhelming when dealing with datasets containing numerous variables, making it challenging to identify patterns and relationships. Interactive plotting tools address this issue by allowing users to manipulate and explore the data in real-time.
Python offers package for visualizing high-dimensional data with parallel coordinates: hiplot which is described as:
HiPlot is a lightweight interactive visualization tool to help AI researchers discover correlations and patterns in high-dimensional data using parallel plots and other graphical ways to represent information.
It's based on Facebook research team work: HiPlot - High dimensional Interactive Plotting - github
Data
For this example we will use Kaggle data: Credit Card Fraud Detection.
The dataset has:
- 31 columns
- 284807 columns
Data looks like:
| Time | V1 | V2 | V3 | V4 | .. | V27 | V28 | Amount | Class | |
|---|---|---|---|---|---|---|---|---|---|---|
| 0 | 0.0 | -1.359807 | -0.072781 | 2.536347 | 1.378155 | .. | 0.133558 | -0.021053 | 149.62 | 0 |
| 1 | 0.0 | 1.191857 | 0.266151 | 0.166480 | 0.448154 | .. | -0.008983 | 0.014724 | 2.69 | 0 |
| 2 | 1.0 | -1.358354 | -1.340163 | 1.773209 | 0.379780 | .. | -0.055353 | -0.059752 | 378.66 | 0 |
| 3 | 1.0 | -0.966272 | -0.185226 | 1.792993 | -0.863291 | .. | 0.062723 | 0.061458 | 123.50 | 0 |
| 4 | 2.0 | -1.158233 | 0.877737 | 1.548718 | 0.403034 | .. | 0.219422 | 0.215153 | 69.99 | 0 |
How to use
Several Python libraries offer tools for high-dimensional interactive plotting, such as:
- hiplot
- Plotly
- Bokeh
- Altair
Not that for big datasets it will take time and resources for plotting. So you may consider using part of the datasets to get familiar with the data.
Example 1 - hiplot
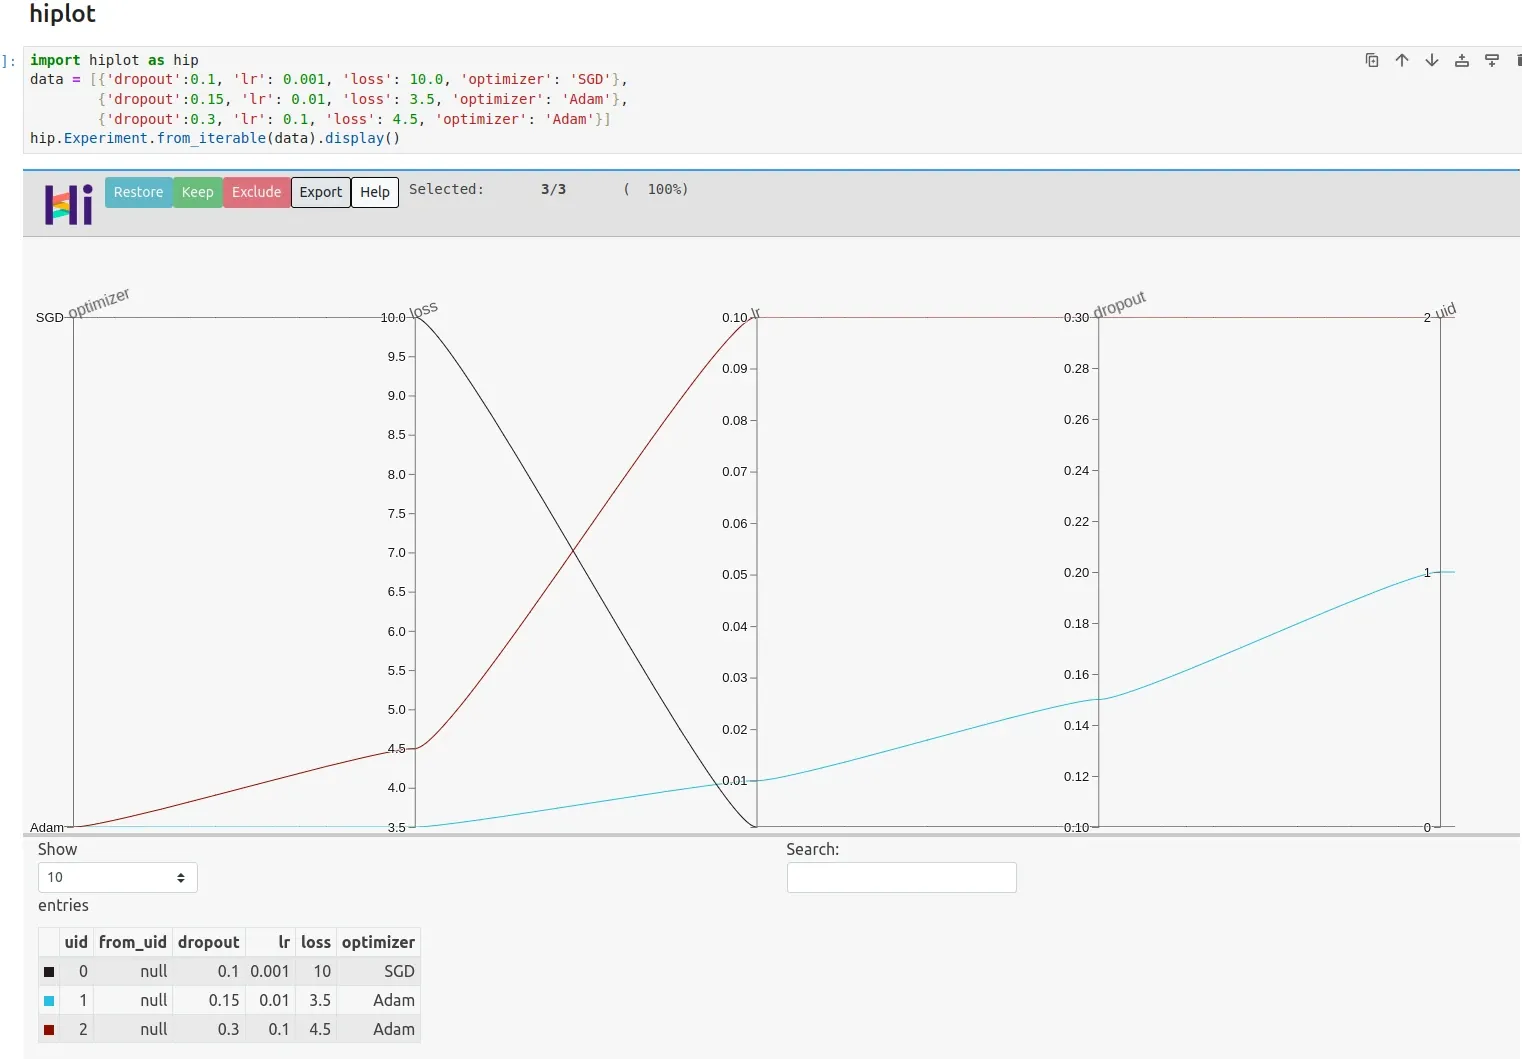
First we will show very basic example of hiplot
import hiplot as hip
data = [{'dropout':0.1, 'lr': 0.001, 'loss': 10.0, 'optimizer': 'SGD'},
        {'dropout':0.15, 'lr': 0.01, 'loss': 3.5, 'optimizer': 'Adam'},
        {'dropout':0.3, 'lr': 0.1, 'loss': 4.5, 'optimizer': 'Adam'}]
hip.Experiment.from_iterable(data).display()
Output
Example 2 - plotly
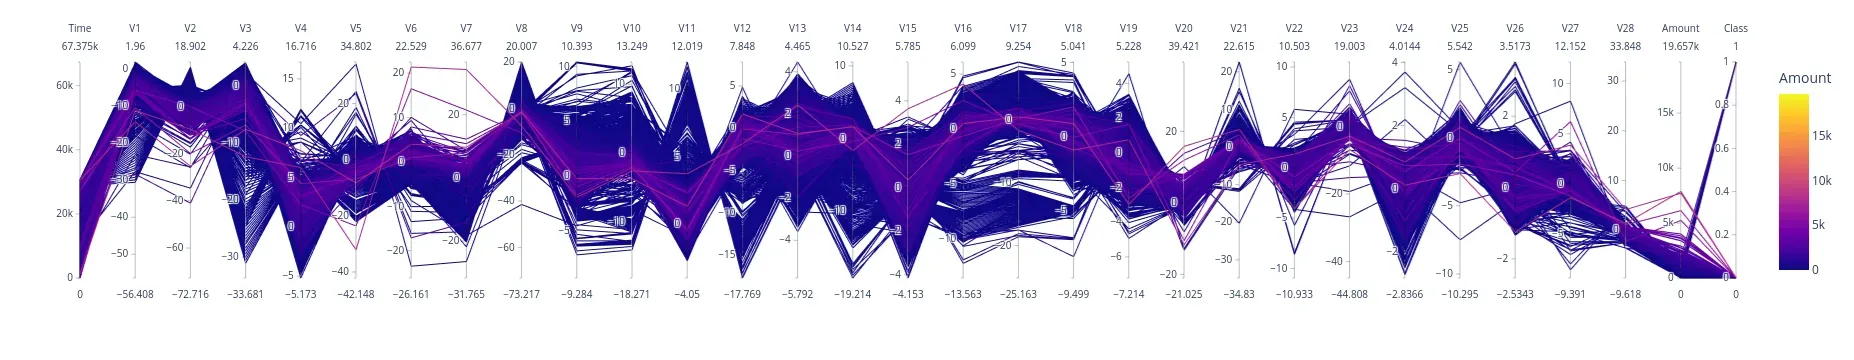
We can use also plotly method parallel_coordinates to visualize high dimensional parallel coordinates:
import plotly.express as px
import pandas as pd


# Create parallel coordinates plot
fig = px.parallel_coordinates(df, color="Amount")
fig
Output
Example 3 - hiplot
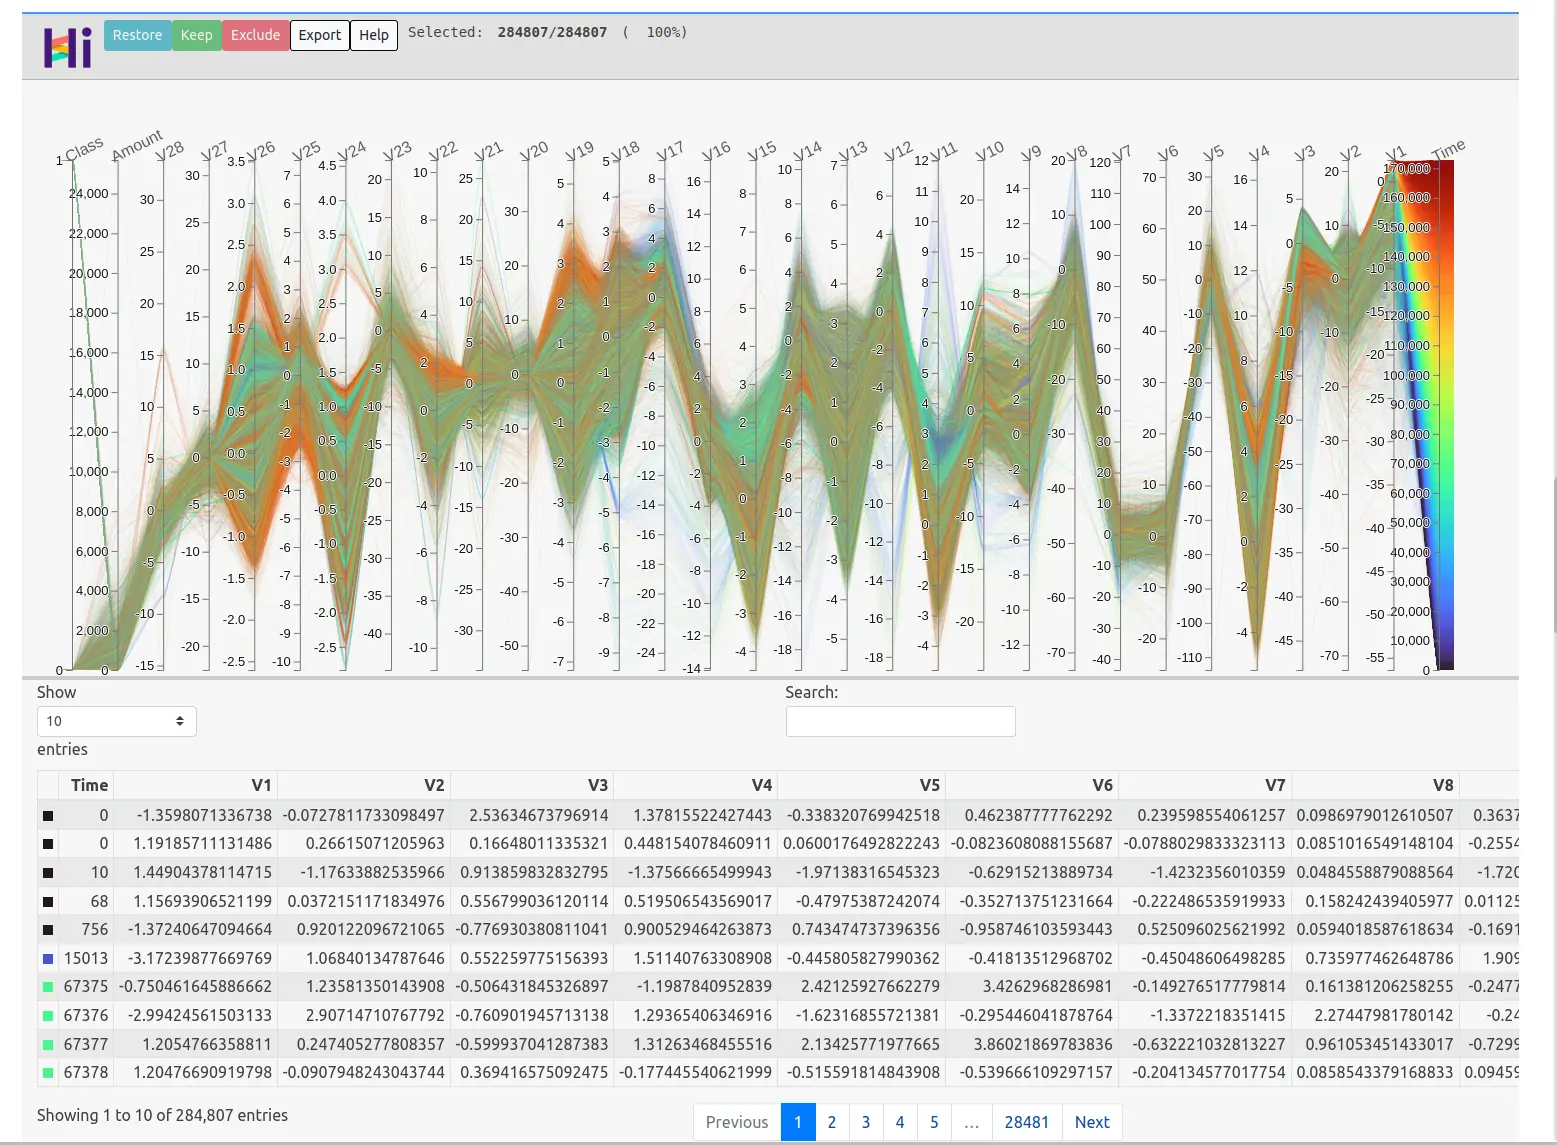
Finally we can see how to read and visulize high dimensional data on real data:
import pandas as pd

df = pd.read_csv('~/Downloads/creditcard.csv')

hip.Experiment.from_dataframe(df).display()
In this example, the code utilizes hiplot to generate an interactive plot, allowing interactive exploration of relationships between different dimensions.
We can search for outliers or correlation between multiple varibles.
Output
We can filter, select or inspect the rows from this plot:
When to use?
High-dimensional interactive plotting is particularly useful in the following scenarios
- Exploring Multivariate Relationships
- Detecting Outliers and Anomalies
- Dimensionality Reduction
- Iterative Analysis
FAQ
-
What is the best way to visualize high dimensional data?
- Utilize dimensionality reduction techniques such as t-SNE or PCA, and then visualize the reduced dimensions using scatter plots or parallel coordinates.
-
What is parallel coordinates visualization?
- Parallel coordinates visualization is a method to visualize high-dimensional data by representing each data point as a polyline connecting its values on each dimension along parallel axes.
-
What are the problems with parallel coordinate plots?
- The problems with parallel coordinate plots include overplotting, clutter, and difficulty in interpretation, especially with large datasets and high dimensions.
-
Which technique is developed specifically for visualization of high dimensional data?
- t-SNE (t-Distributed Stochastic Neighbor Embedding) is specifically designed for visualizing high-dimensional data by preserving local similarities.
-
What graph is best for large amounts of data?
- Techniques like scatter plots, heatmaps, or treemaps are suitable for visualizing large datasets, depending on the data's structure and purpose.
-
What are multidimensional visualization techniques?
- Multidimensional visualization techniques include parallel coordinates, scatter plots, heatmaps, and dimensionality reduction methods such as PCA and t-SNE.
Resources
- Visualizing High-Dimensional Data With Parallel Coordinates - detailed explanation with multiple examples
- Parallel Coordinates Plot in Python
- hiplot