


This article shows how to jitter data points with seaborn.stripplot() so overlapping observations become visible when multiple datapoints share the same X and Y values.
Why Use Stripplot for Jittering?
Often multiple datapoints have exactly the same X and Y values. As a result, points get plotted over each other and hide (overplotting). Jittering the points slightly makes each one visible. Using stripplot() helps:
- Reveal hidden points that share identical values
- Show the true density and distribution of data
- Keep the plot readable with a simple one-line parameter (
jitter)
Steps to Jitter Points with Stripplot
- Import required libraries (
matplotlib,seaborn,pandas) - Create or load a dataset with categorical X values
- Call
sns.stripplot()withjitter=True(default) or a custom jitter amount - Optionally combine with
alphafor transparency
Dataset: Categorical Measurements
The sample dataset contains a categorical column (Category) and a numeric value column (Value), where many rows repeat the same measurements — a classic overplotting scenario.
import numpy as np
import pandas as pd

np.random.seed(42)
categories = ["A", "B", "C", "D"]
vals = np.array([1, 2, 2, 3, 3, 3, 4, 5])

data = pd.DataFrame({
    "Category": np.random.choice(categories, size=200),
    "Value": np.random.choice(vals, size=200) + np.random.normal(0, 0.6, size=200)
})
data.head()
Example: Plot With and Without Jitter
import matplotlib.pyplot as plt
import seaborn as sns
%matplotlib inline

fig, axes = plt.subplots(1, 2, figsize=(12, 5), sharey=True)

# No jitter: identical points hide behind each other
sns.stripplot(data=data, x="Category", y="Value", ax=axes[0],
              color="gray", jitter=False)
axes[0].set_title("Without jitter (points overlap)")

# Jitter: points spread out and become visible
sns.stripplot(data=data, x="Category", y="Value", ax=axes[1],
              color="steelblue", jitter=0.25, alpha=0.6)
axes[1].set_title("With jitter=0.25 (all points visible)")

plt.tight_layout()
plt.show()
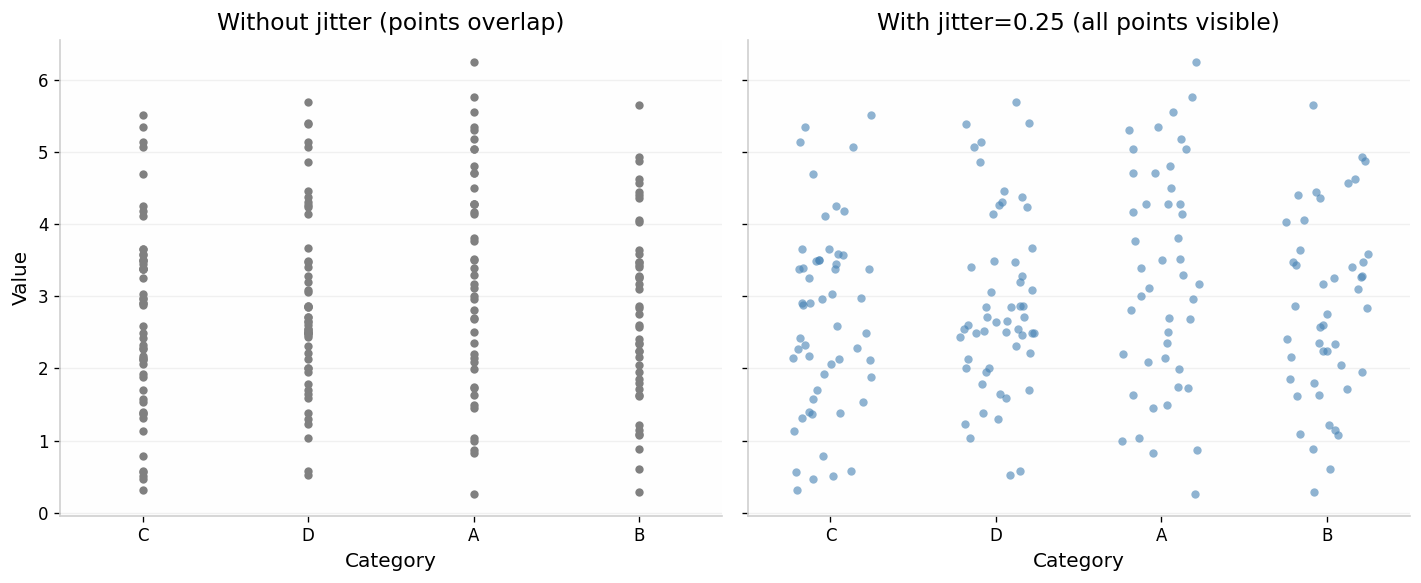
Output
- Left plot: points with identical values are stacked on top of each other and partially hidden.
- Right plot: the
jitter=0.25parameter spreads points horizontally around each category, so every datapoint is visible. alpha=0.6adds transparency, making dense regions easier to read.
Customizations
- Adjust
jitter=0.4for a wider spread of points (0 = no jitter, 1 = maximum spread) - Use
alpha=0.5insns.stripplot()for better visibility in dense areas - Add
size=4to make points smaller when the dataset is large - Combine with
sns.boxplot()to overlay points on a boxplot summary
Resources
- Seaborn Stripplot
- Seaborn Boxplot
- Matplotlib Subplots
- Pandas DataFrame
Frequently Asked Questions
What does jitter do in Seaborn stripplot?
Jitter adds a small amount of random horizontal displacement to each point, preventing overplotting when multiple points share the same X and Y values.
How do I turn off jitter in stripplot?
Pass jitter=False to sns.stripplot(). This plots all points in a straight vertical line, which causes identical values to overlap.
Is stripplot jitter random each time?
Yes, jitter uses random noise. Set a random seed (e.g., np.random.seed(42)) before plotting if you need reproducible results.
