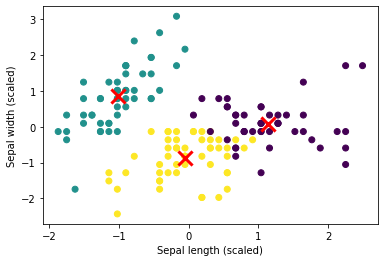
To implement Kmeans clustering in Python we can use module - sklearn
Steps of Kmeans
- Import of libraries
- Load the Iris dataset
- Data preprocess
- Build the Kmeans model
- Visualize the results
Data
{'data': array([[5.1, 3.5, 1.4, 0.2],
        [4.9, 3. , 1.4, 0.2],
        [4.7, 3.2, 1.3, 0.2],
        [4.6, 3.1, 1.5, 0.2],
Data can be downloaded from seaborn module too:
import seaborn as sns
iris = sns.load_dataset("iris")
data:
| sepal_length | sepal_width | petal_length | petal_width | species | |
|---|---|---|---|---|---|
| 0 | 5.1 | 3.5 | 1.4 | 0.2 | setosa |
| 1 | 4.9 | 3.0 | 1.4 | 0.2 | setosa |
| 2 | 4.7 | 3.2 | 1.3 | 0.2 | setosa |
| 3 | 4.6 | 3.1 | 1.5 | 0.2 | setosa |
| 4 | 5.0 | 3.6 | 1.4 | 0.2 | setosa |
Example
from sklearn.datasets import load_iris
from sklearn.preprocessing import StandardScaler
from sklearn.cluster import KMeans
import matplotlib.pyplot as plt


iris = load_iris()
X = iris.data

scaler = StandardScaler()
X_scaled = scaler.fit_transform(X)

kmeans = KMeans(n_clusters=3, random_state=42)
kmeans.fit(X_scaled)

plt.scatter(X_scaled[:, 0], X_scaled[:, 1], c=kmeans.labels_)
plt.scatter(kmeans.cluster_centers_[:, 0], kmeans.cluster_centers_[:, 1], marker='x', s=200, linewidths=3, color='r')
plt.xlabel('Sepal length (scaled)')
plt.ylabel('Sepal width (scaled)')
plt.show()
Output


