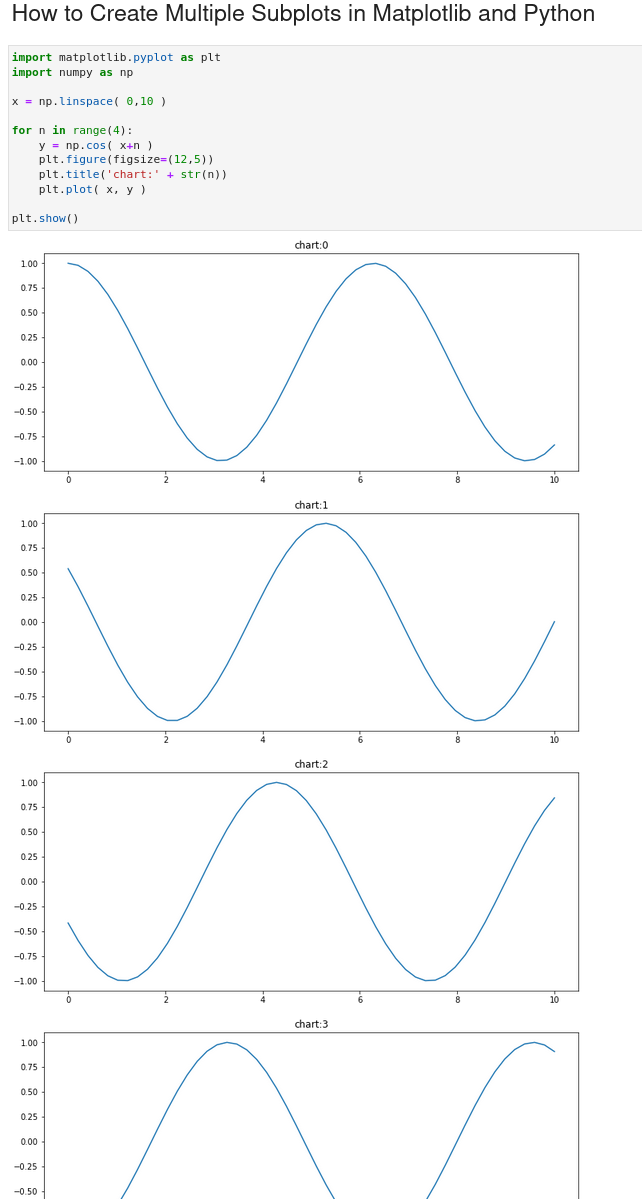
To create multiple plots in Matplotlib and Python we need to use plt.figure() in order to create separate plots.
Steps
- Import library - matplotlib
- Select data to be plot
- select the columns which will be used for the plot
- Loop over the selected data
- Create plot figure and select figure size
- Set title for each plot
- Select chart type
barplotboxplot
More information can be found: Creating multiple subplots using
Data
For this example we will create evenly spaced numbers over interval - 0 to 10 - by np.linspace( 0,10 )
Then we will plot the function np.cos().
The data will look like:
| x | y | |
|---|---|---|
| 0 | 0.000000 | 0.909297 |
| 1 | 0.204082 | 0.806088 |
| 2 | 0.408163 | 0.669421 |
| 3 | 0.612245 | 0.504970 |
| 4 | 0.816327 | 0.319561 |
To plot multiple plots we will increase the initial value
Example
So to plot multiple plots with matplotlib we need to provide the plt.figure()
import matplotlib.pyplot as plt
import numpy as np

x = np.linspace( 0,10 )

for n in range(4):
    y = np.cos( x+n )
    plt.figure(figsize=(12,5))
    plt.title('chart:' + str(n))
    plt.plot( x, y )

plt.show()
Output

×
Note
that if
that if
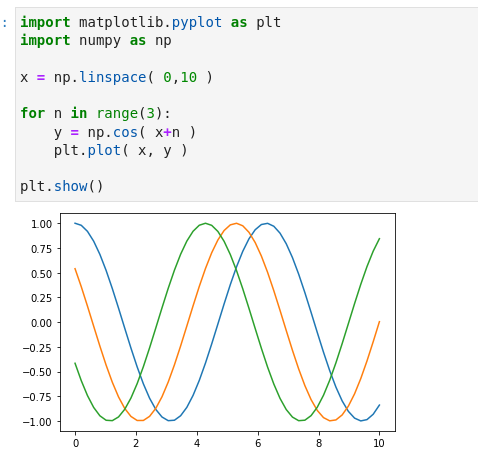
plt.figure(figsize=(12,5))is missed the plots will be on a single figure


