


In this short post you can find an example on how to add custom legend in Matplotlib and Python. The example is showing a simple Scatterplot of few random points.
import random
import numpy as np
import matplotlib.pyplot as plt
from matplotlib.lines import Line2D

custom = [Line2D([], [], marker='.', markersize=20, color='b', linestyle='None'),
          Line2D([], [], marker='.', markersize=20, color='r', linestyle='None')]

fig = plt.figure(figsize=(8,5))

x = np.random.normal(0,1,15)
y = np.random.normal(0,1,15)

colors = ['r', 'b']
z = [random.choice(colors) for i in range(0,15)]

plt.scatter(x, y, c=z)

plt.legend(custom, ['Yes', 'No'], loc='upper left', fontsize=15)
plt.show()
result:
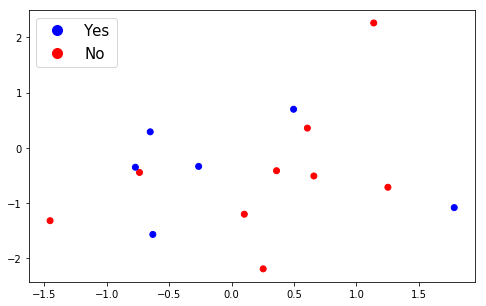
Explanation of custom Scatterplot legend
In order to create custom legend with Matplotlib and Scatterplot we follow next steps:
First we start with creating the legend handles which are described as:
handles : sequence of
.Artist, optional
A list of Artists (lines, patches) to be added to the legend.
Use this together with labels, if you need full control on what
is shown in the legend and the automatic mechanism described above
is not sufficient.
by:
custom = [Line2D([], [], marker='.', markersize=20, color='b', linestyle='None'),
          Line2D([], [], marker='.', markersize=20, color='r', linestyle='None')]
next we set the legend labels, the font size and the legend position by:
plt.legend(custom, ['Yes', 'No'], loc='upper left', fontsize=15)
In order to plot the Scatterplot we generate 2 lists of random integers by:
x = np.random.normal(0,1,15)
and list of random colors by:
colors = ['r', 'b']
z = [random.choice(colors) for i in range(0,15)]
Custom Scatterplot legend with multiple options
If you need to create a custom legend with multiple options you can use Python list comprehensions like:
custom = [ Line2D([], [], marker='.', color=i, linestyle='None', markersize=25) for i in region_colors.values()]
where region_colors.values() are all unique values from your DataFrame in the form of a dictionary with their colours. For example:
region_colors = {'Central and Eastern Europe':'red', 'Western Europe':'red',
                 'Sub-Saharan Africa':'green', 'Middle East and Northern Africa':'green',
                 'North America':'blue', 'Latin America and Caribbean':'blue',
                 'Southeastern Asia':'cyan', 'Southern Asia':'cyan', 'Eastern Asia':'cyan',
                 'Australia and New Zealand':'purple'}