To create Word Cloud in Python we will use a library called wordcloud.
It can be installed by:
pip install wordcloud
Word cloud also known as:
- tag cloud
- wordle
- weighted list
is a visual representation of text data.
Step 1: Create word cloud from text
For the first example we will create word cloud from a string.
If the word wight doesn't matter we can use method - wc.generate(text):
from wordcloud import WordCloud
import matplotlib.pyplot as plt

wc = WordCloud(background_color="white", random_state=None)

text = " Thank You Gracias Merci Danke obrigado спасибо Xie xie благодаря dhanyavaad"

wc.generate(text)
plt.imshow(wc, interpolation="bilinear")
plt.axis('off')
plt.show()

Step 2: Create word cloud by frequency
If the word order matters then we can use the method: wc.generate_from_frequencies(freq).
This method requires dictionary of words with their frequency:
freq = {
    "Thank You": 100,
"Merci": 99,
"Danke": 98,
Below you can find full example of generating word cloud with word frequency:
from wordcloud import WordCloud
import matplotlib.pyplot as plt

wc = WordCloud(background_color="white")
freq = {
    "Thank You": 100,
    "Merci": 99,
    "Danke": 98,
    "obrigado": 97,
    "спасибо": 96,
    "Xie xie": 95,
    "Gracias": 94,
    "благодаря": 93,
    "dhanyavaad": 92,
    "dziękuję": 91,
    "Thank you": 90,
    "Dank u": 89
}

wc.generate_from_frequencies(freq)

plt.imshow(wc, interpolation="bilinear")
plt.axis('off')
plt.show()
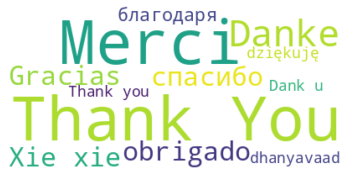
the result is:

Step 3: Create word cloud from shape
Finally let's create a word cloud masked with a shape.
We are going to generate a word cloud from 100 ways to say "Thank you!" in 100 different languages. The code is below:
from wordcloud import WordCloud
import matplotlib.pyplot as plt
from PIL import Image
import numpy as np

mask = np.array(Image.open('rect821.png'))

wc = WordCloud(background_color="white", max_words=2000, mask=mask, contour_width=3, contour_color='steelblue')
freq = {
    "Thank You": 100,
"Merci": 99,
"Danke": 98,
"obrigado": 97,
"спасибо": 96,
"благодаря": 95,
"o ṣeun": 1,
"Ngiyabonga": 0**
}

wc.generate_from_frequencies(freq)
plt.figure(figsize=(20,10) )
plt.imshow(wc, interpolation="bilinear")
plt.axis('off')
plt.show()
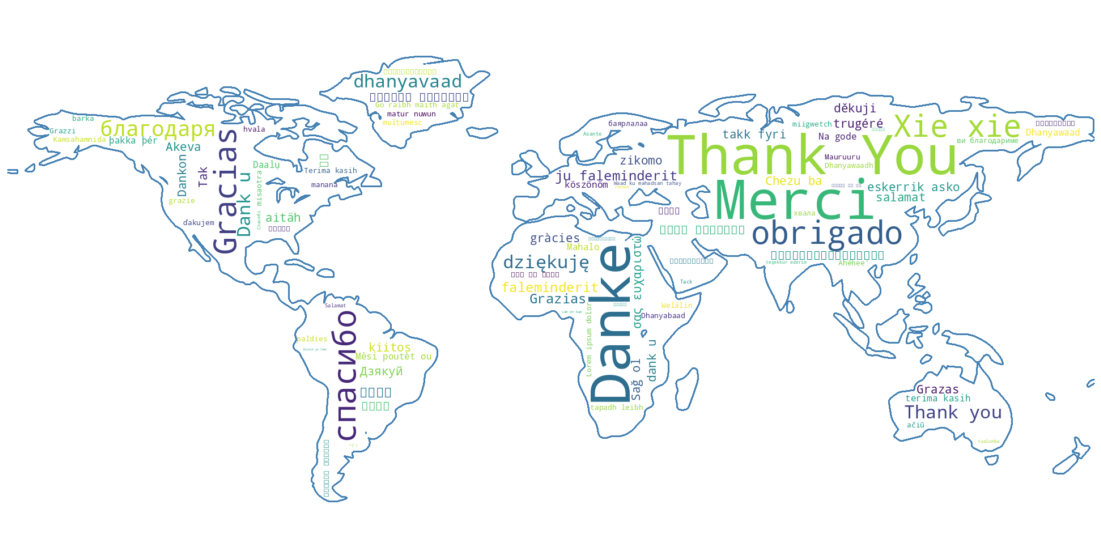
Below you can find the result of the code above:

Few things to have in mind when you are working with mask:
- the image used for a mask - should have white background. If you try to use others - it will break the shape.
- Free shapes can be taken from: pixabay - just edit and add background
- Sometimes the size of the output image might not respect the parameters passed to
WordCloud()


