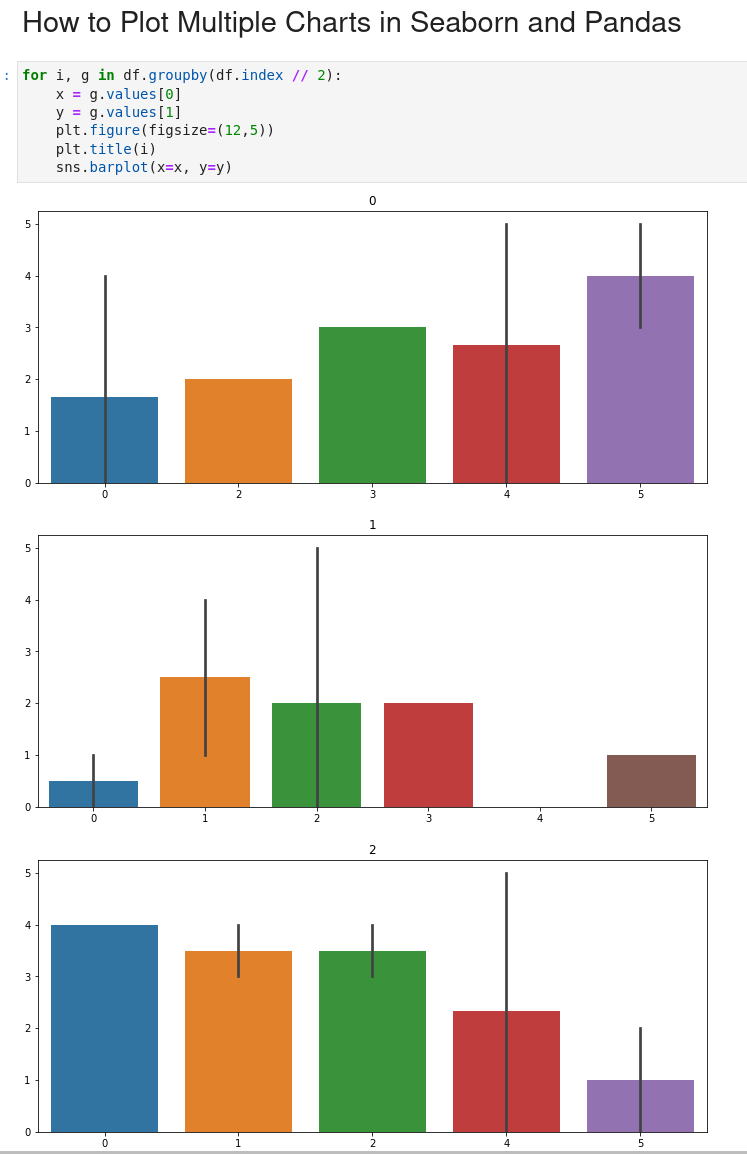
To plot multiple plots in Seaborn and Python we can loop through different rows or columns in Pandas DataFrame.
Steps to plot 2 variables
- Import library - seaborn
- Select data to be plot
- select the columns which will be used for the plot
- select - x values
- select - y values
- select the columns which will be used for the plot
- Loop over the selected data
- Create plot figure and select size
- Set title for each plot
- Select chart type
barplotboxplot
More information can be found: Example gallery
Data
Sample DataFrame to plot multiple charts in loop:
import numpy as np
import pandas as pd
import string

string.ascii_lowercase

n = 6
m = 10

cols = string.ascii_lowercase[:m]
df = pd.DataFrame(np.random.randint(0, n,size=(n , m)), columns=list(cols))
data:
| a | b | c | d | e | f | g | h | i | j | |
|---|---|---|---|---|---|---|---|---|---|---|
| 0 | 3 | 0 | 5 | 4 | 1 | 4 | 0 | 2 | 4 | 2 |
| 1 | 4 | 5 | 0 | 4 | 1 | 3 | 2 | 3 | 2 | 5 |
| 2 | 4 | 3 | 3 | 1 | 3 | 3 | 1 | 4 | 0 | 1 |
| 3 | 1 | 3 | 4 | 4 | 5 | 1 | 2 | 4 | 3 | 0 |
| 4 | 4 | 0 | 5 | 2 | 4 | 1 | 5 | 5 | 1 | 3 |
Example
for i, g in df.groupby(df.index // 2):
    print(g.values)
    x = g.values[0]
    y = g.values[1]
    plt.figure(figsize=(12,5))
    plt.title(i)
    sns.barplot(x=x, y=y)
Output


